The cgNA+ model
cgNA+ is a sequence-dependent, coarse-grain, model for double stranded nucleic acids (dsNA),
which includes an explicit description of bases and phosphate groups,
each approximated as a rigid body. For a complete description of the model see
the cgDNA website,
and the publications described there, particularly the PhD thesis of A. Patelli and R. Sharma.
Briefly, given an arbitrary input sequence in the standard alphabet {A,T,C,G,U} and non-standard
alphabets for epigenetically modified CpG steps {MN, MG, CN, HK, HG, CK},
(along the reading, or Watson, strand in the 5'-3' direction)
with one of the provided parameter sets appropriate to chosen sequence,
the cgNA+ model predicts a Gaussian (or multi-variate normal) probability density function
(or PDF) for the dsNA configuration expressed in internal dsNA coordinates
(more specifically a version of the standard Curves+ helicoidal coordinates for the relative
rigid body displacements between bases, and an additional three translation and three rotation coordinates
for the relative rigid body displacement between the base and phosphate group making up each nucleotide).
The cgNA+ coarse-grain model is itself a slightly finer-grain evolution from the prior
cgDNA coarse-grain model, which did not include an explicit treatment of the phosphate groups.
cgNA+ coordinates
In the cgNA+ model each interior (i.e. neither the first nor last) base pair
level is approximated by four rigid bodies, specifically two (non-rigid)
nucleotides each made up of a (rigid) base and a (rigid) phosphate group
(but the two 5' phosphate groups are omitted from the first and last base pair levels).
(The sugars are of course explicitly present in any MD simulation, but they are only implicit in the cgNA+ coarse graining.)
Each additional interior dinucleotide step, or base pair junction, between adjacent base pair levels, adds 24 additional coarse grain coordinates;
twelve familiar and standard coordinates namely (a Curves+ implementation of the Tsukuba convention for)
six intra base pair coordinates (buckle, propeller, opening, shear, stretch, stagger) and
six inter base pair (or junction) coordinates (tilt, roll, twist, shift, slide, rise),
plus two, less familiar, analogous sets of relative rotations and translations (η1, η2, η3, w1, w2, w3)
serving to locate each phosphate group, one in each backbone, with respect to the base within its nucleotide.
The cgNA+ units of translations are Angstroms and for rotations fifth radians (or approximately 11.5 degrees).
This nonstandard choice of unit for rotations is for reasons of good numerical scaling internal to the model,
but for the sake of familiarity cgNA+web can also output rotational coordinates converted to degrees.
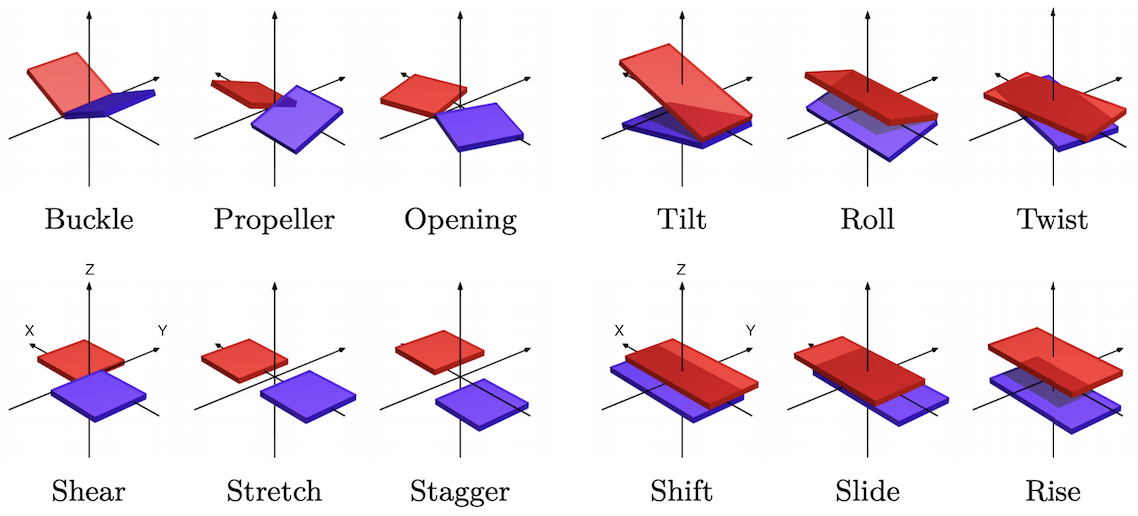
Schematic of CURVES+ coordinates of a coarse-grain DNA configuration with positive values of each coordinate shown. On right Inter base-pair variables: top, three Cayley rotation vector coordinates, bottom three translation vector components, all expressed in the halfway, junction frame. X axis toward reading strand back-bone, Y axis into major groove, Z axis approximately in the 5'-3' orientation of the reading strand, or equivalently toward base pair level a+1 from base pair level a. On left intra base pair coordinates, again three rotation and three translation components now expressed in the half way or base pair frame, and with the rigid body displacement being from the non-reading to the reading strand.
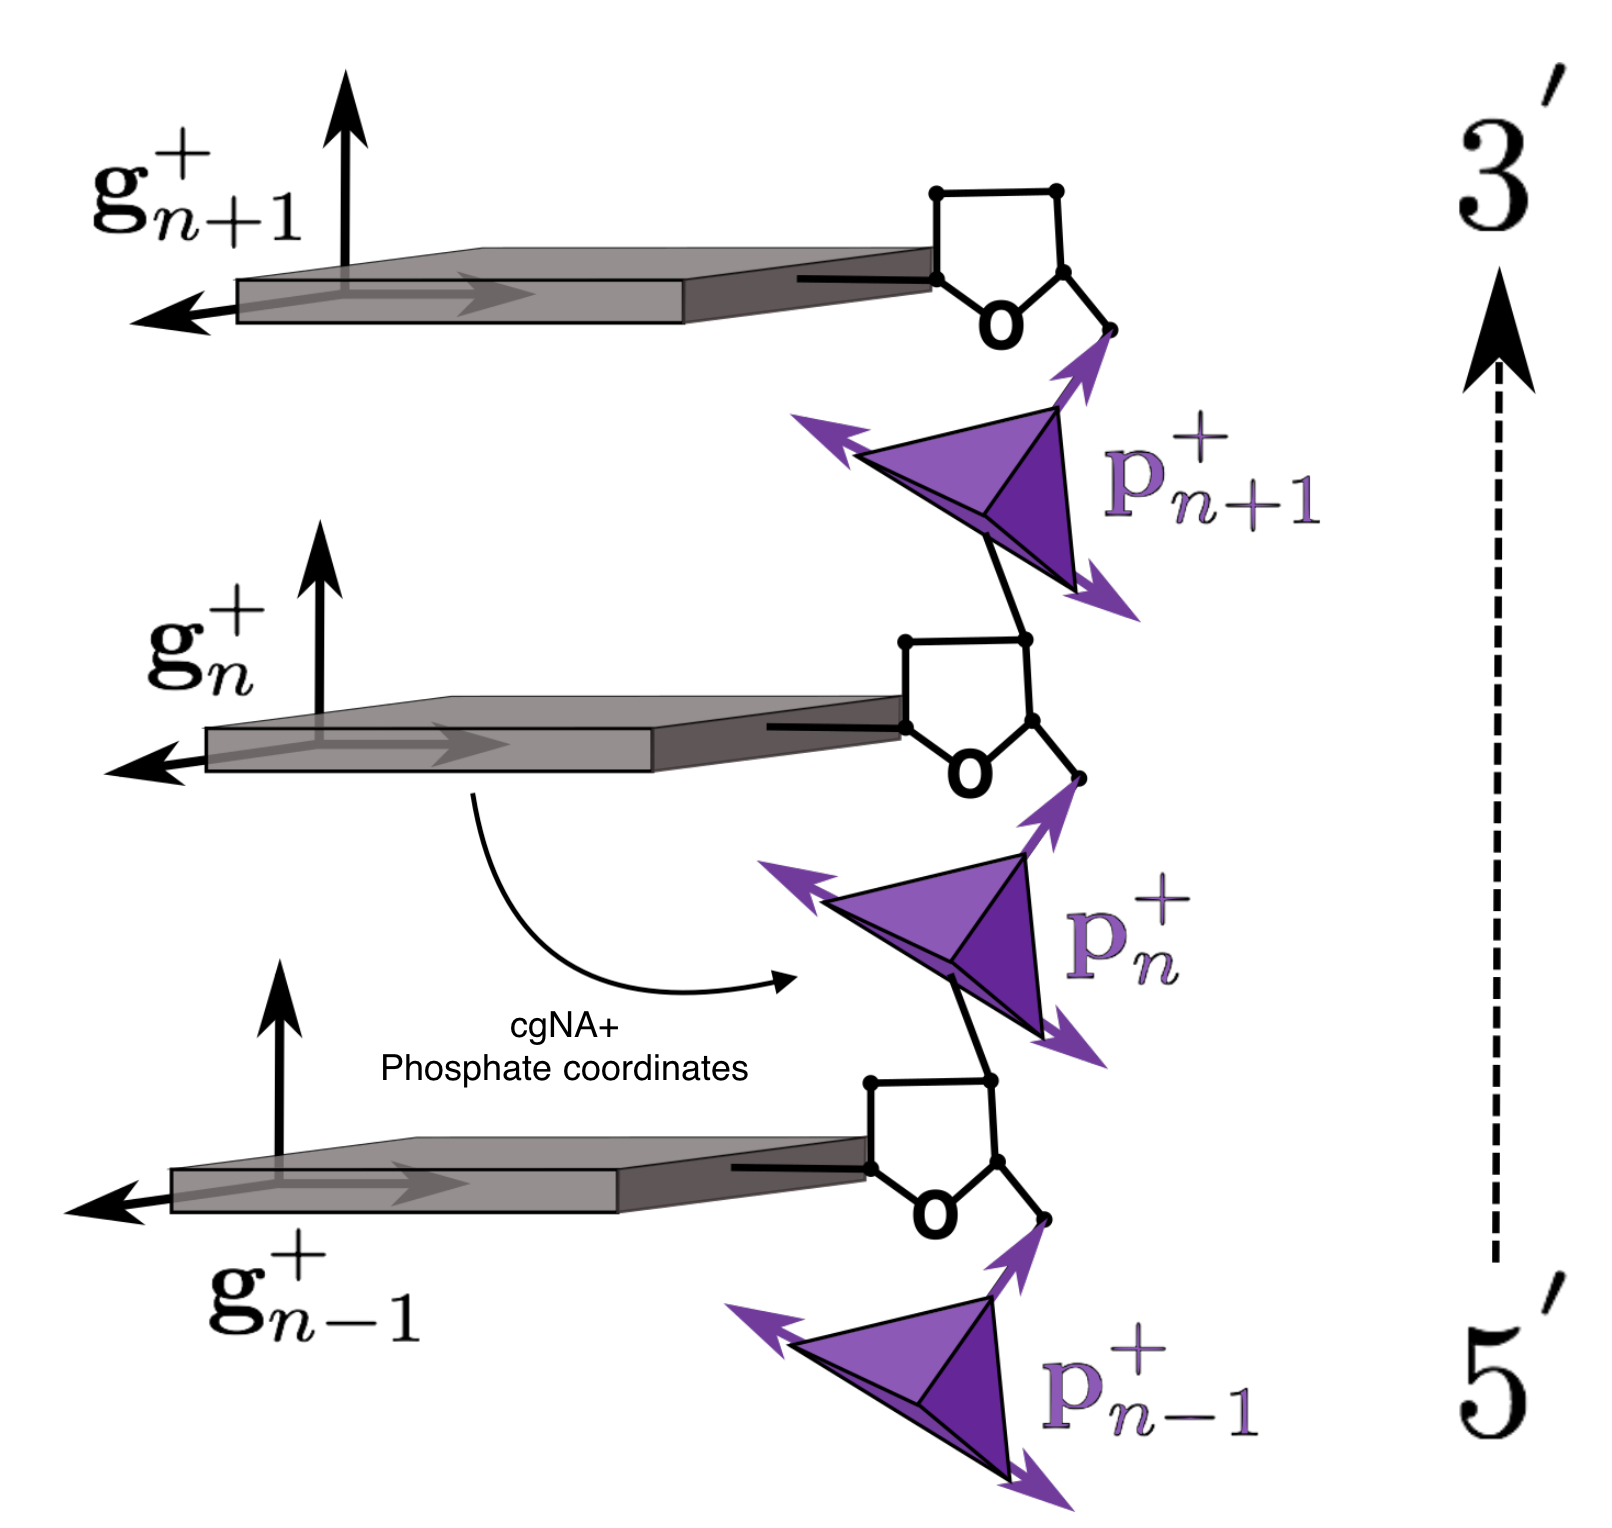
Schematic representation of the reading strand (denoted by subscript +) of a coarse-grained DNA fragment.
cgNA+ phosphate coordinates are now an additional three rotation and three translation
coordinates of the 5' phosphate group expressed in its associate base frame (as indicated by the arrow).
Note that in the figure the sugar ring is shown but is only treated implicitly in the cgNA+ model.
Comparison of cgNA+ predictions with Molecular Dynamics simulations
cgNA+ parameter sets are trained on extensive atomistic MD simulations using state-of-the-art MD simulation protocol, and the model accurately captures the underlying sequence-dependent mechanics of dsNAs. The model have been tested throughly for numerous diverse sequences including A-tracts, CpG islands, random sequences, poly(A), and poly(AT).
Here, in Figure 1, we have shown results for one random sequence GCATTACGCTCCGGAGCGTAATGC
that is outside the training library and contains all dimer
steps at least once on the reading strand.
Firstly, one can observe a strong sequence dependence
in the groundstate coordinates, and more importantly, the cgNA+ model
accurately captures this underlying sequence dependence in the groundstate
of various kinds of dsNAs. Notably, the error between MD and model (dashed
versus solid lines) is always significantly smaller than the variation along the
sequence. Some of the interesting features of various dsNAs can also be
observed; for instance, slide and twist for DRH are in between dsDNA and
dsRNA. The phosphate coordinate η2 for dsRNA and dsDNA are strikingly
different (can be attributed to the general A- and B-form of dsRNA and
dsDNA, respectively) whereas η2 Watson phosphate rotational coordinate
(i.e. DNA strand of DRH) is close to pure dsDNA while the same coordinate
for Crick phosphates (i.e. RNA strand of DRH) is close to pure dsRNA.
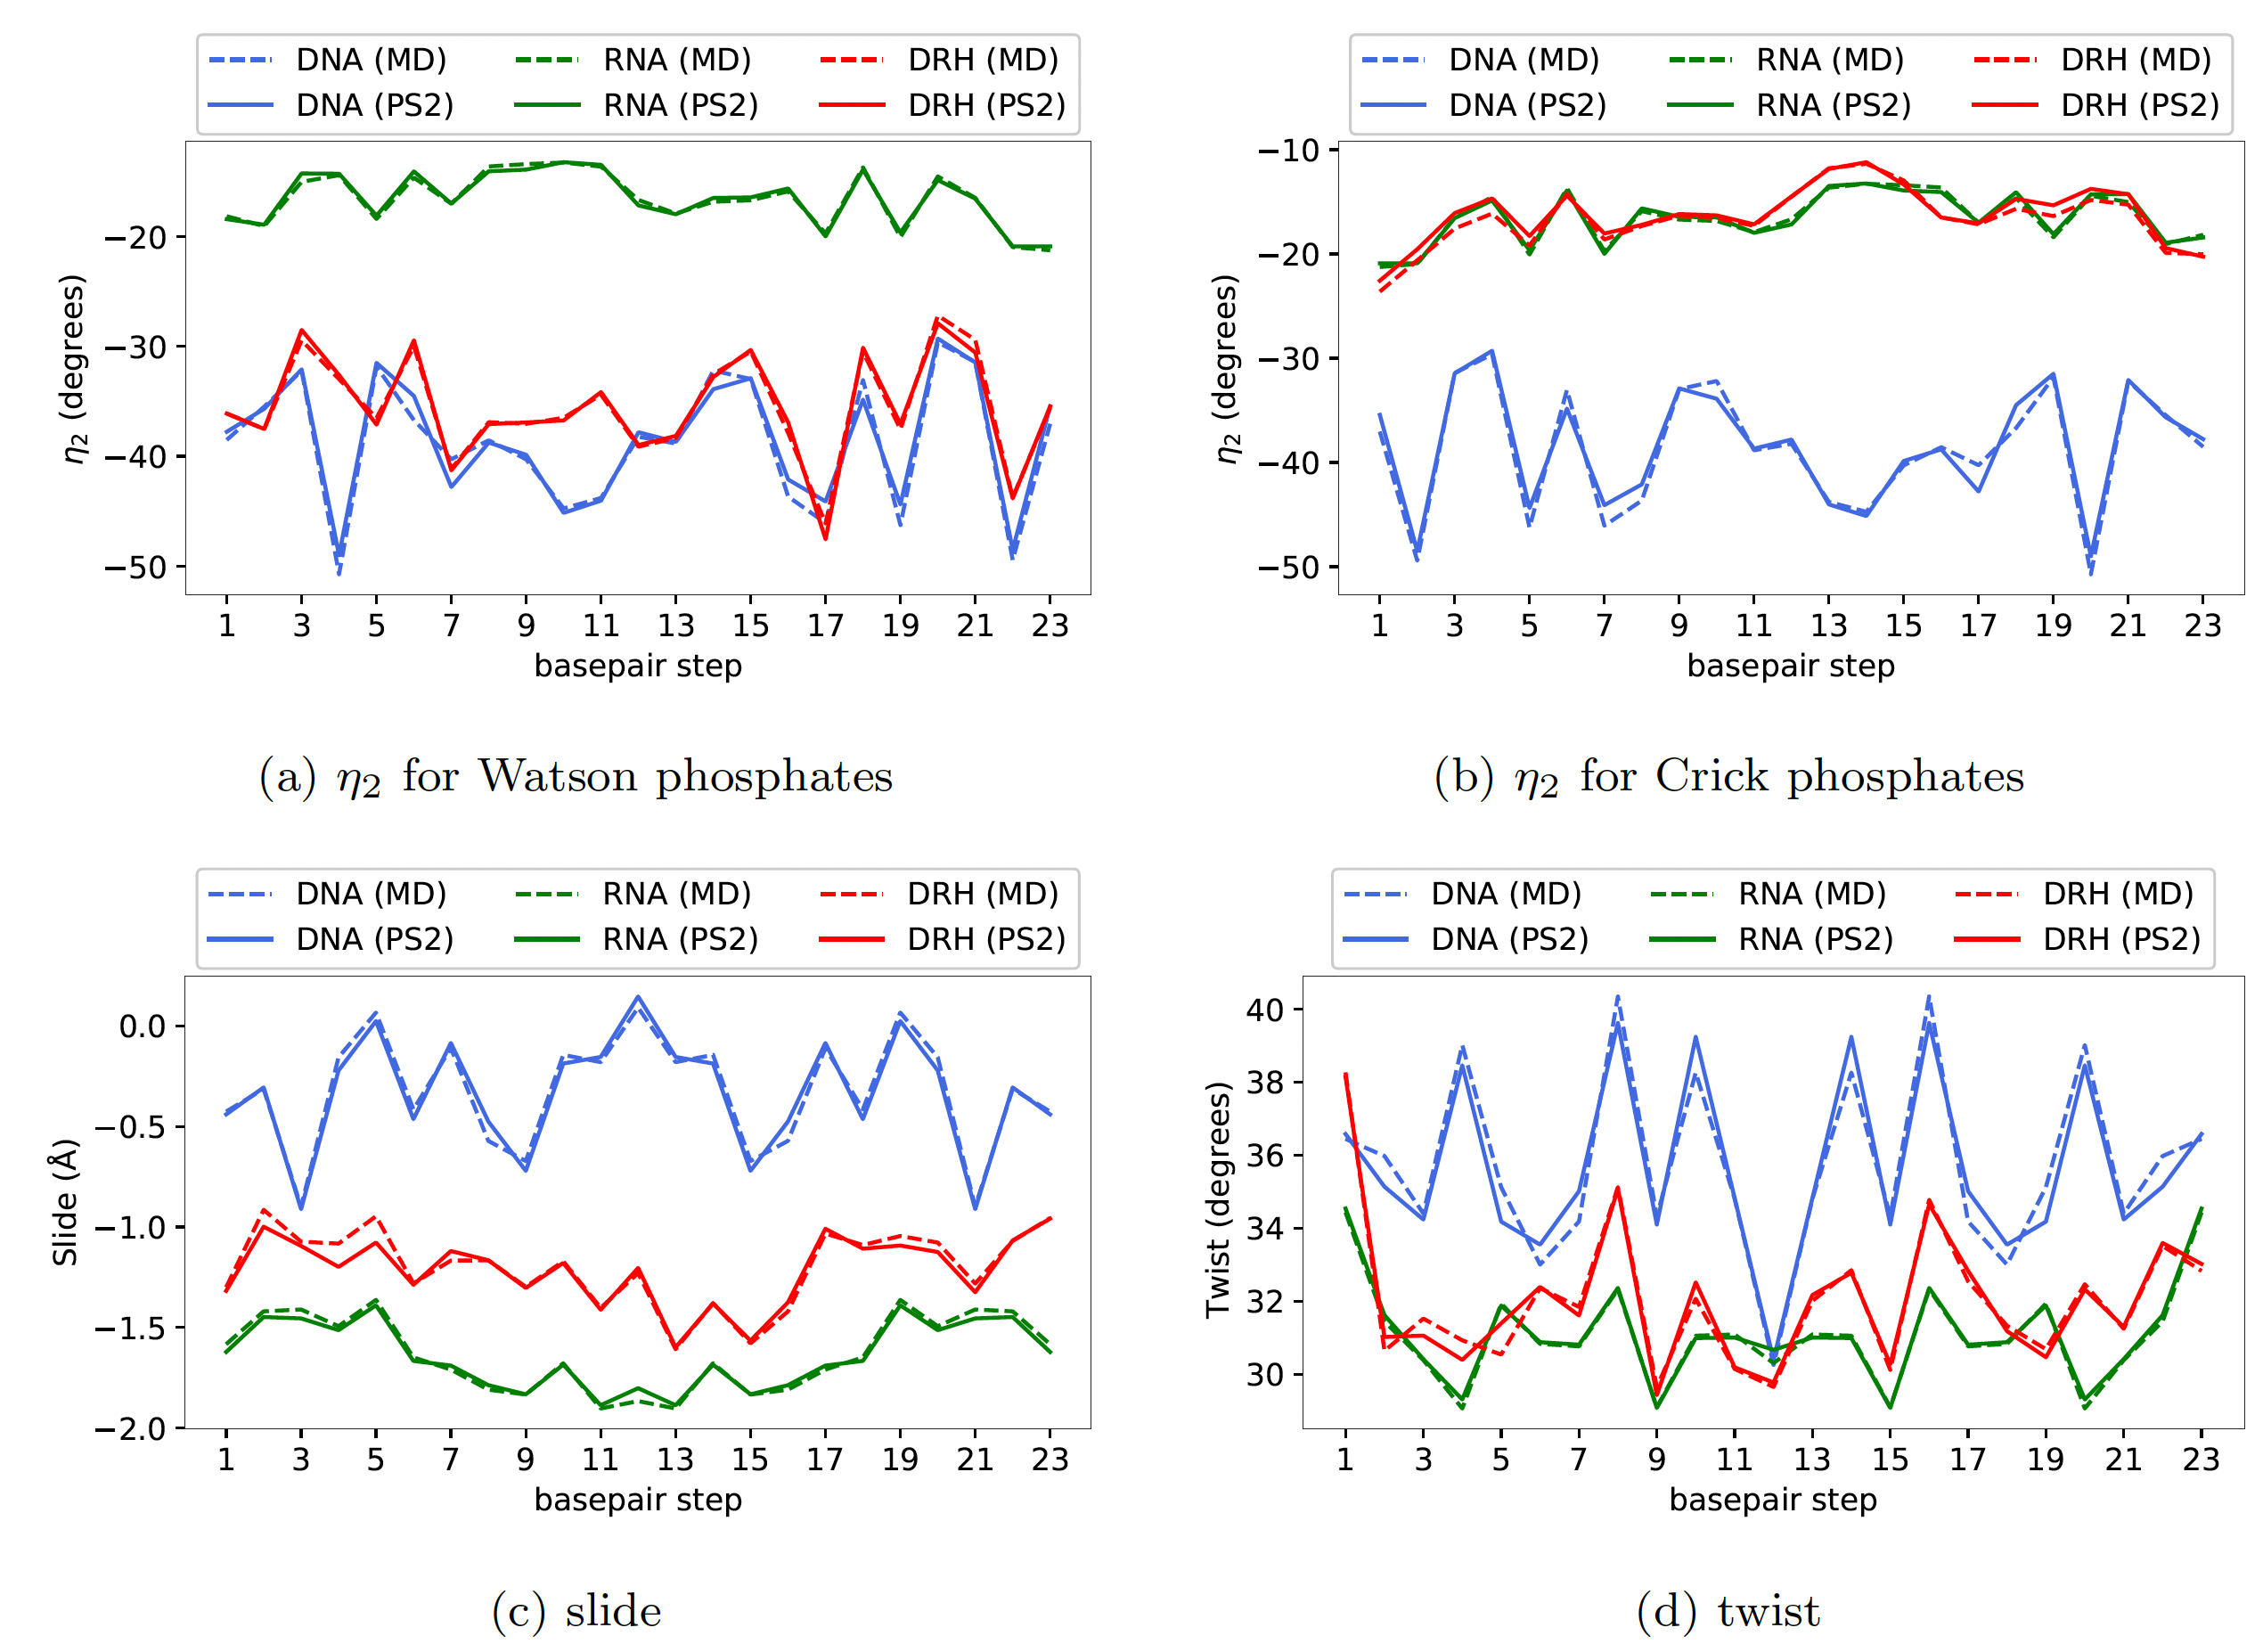
Figure 1
For the ground states of a 24mer sequence GCATTACGCTCCGGAGCGTAATGC (not in the training library and containing all dinucleotide steps), with versions
for dsDNA (blue), dsRNA (green) and DRH (red), plots of (a) the η2 rotation coordinate
for Watson-strand phosphates, (b) η2 for Crick-strand phosphates, (c) slide, and (d) twist,
with solid lines being the cgNA+ model predictions, and dashed line data being taken
directly from atomistic MD simulation. In all cases the error between MD observations
and cgNA+ predictions is negligible compared to variation with sequence. (Data for other
coordinates and other sequences entirely analogous.)
cgNA+ parameter sets, trained on extensive atomistic MD simulations
using state-of-the-art MD simulation protocol, accurately
captures the underlying sequence-dependent mechanics of dsNAs (see Figure 1);
however, it should be noted that different MD protocols may lead to different
atomistic equilibrium distributions, which also get reflected in cgNA+
parameter sets. In Figure 2, we have plotted the average shape of a dsDNA
sequence observed in MD simulations but simulated using two different MD protocols
(MD1 and MD2) along with the corresponding cgNA+ predictions
(the parameter sets are available as ‘DNA PS1’ and ‘DNA PS2’ on the cgNA+web)
trained on the same training sequences.
The differences between the two MD protocols are in the water
model, ion model, and length of the MD simulations for each training
sequence which are SPC/E, Dang, and 3 μs for MD1 and TIP3P, Joung and
Cheatham ion model, and 10 μs for MD2. More details on the MD protocol are provided in Get Started pane.
For this particular sequence, the
average shape observed in two MD simulations is considerably different, but
the corresponding cgNA+ predictions are almost indistinguishable from the
underlying MD estimates.
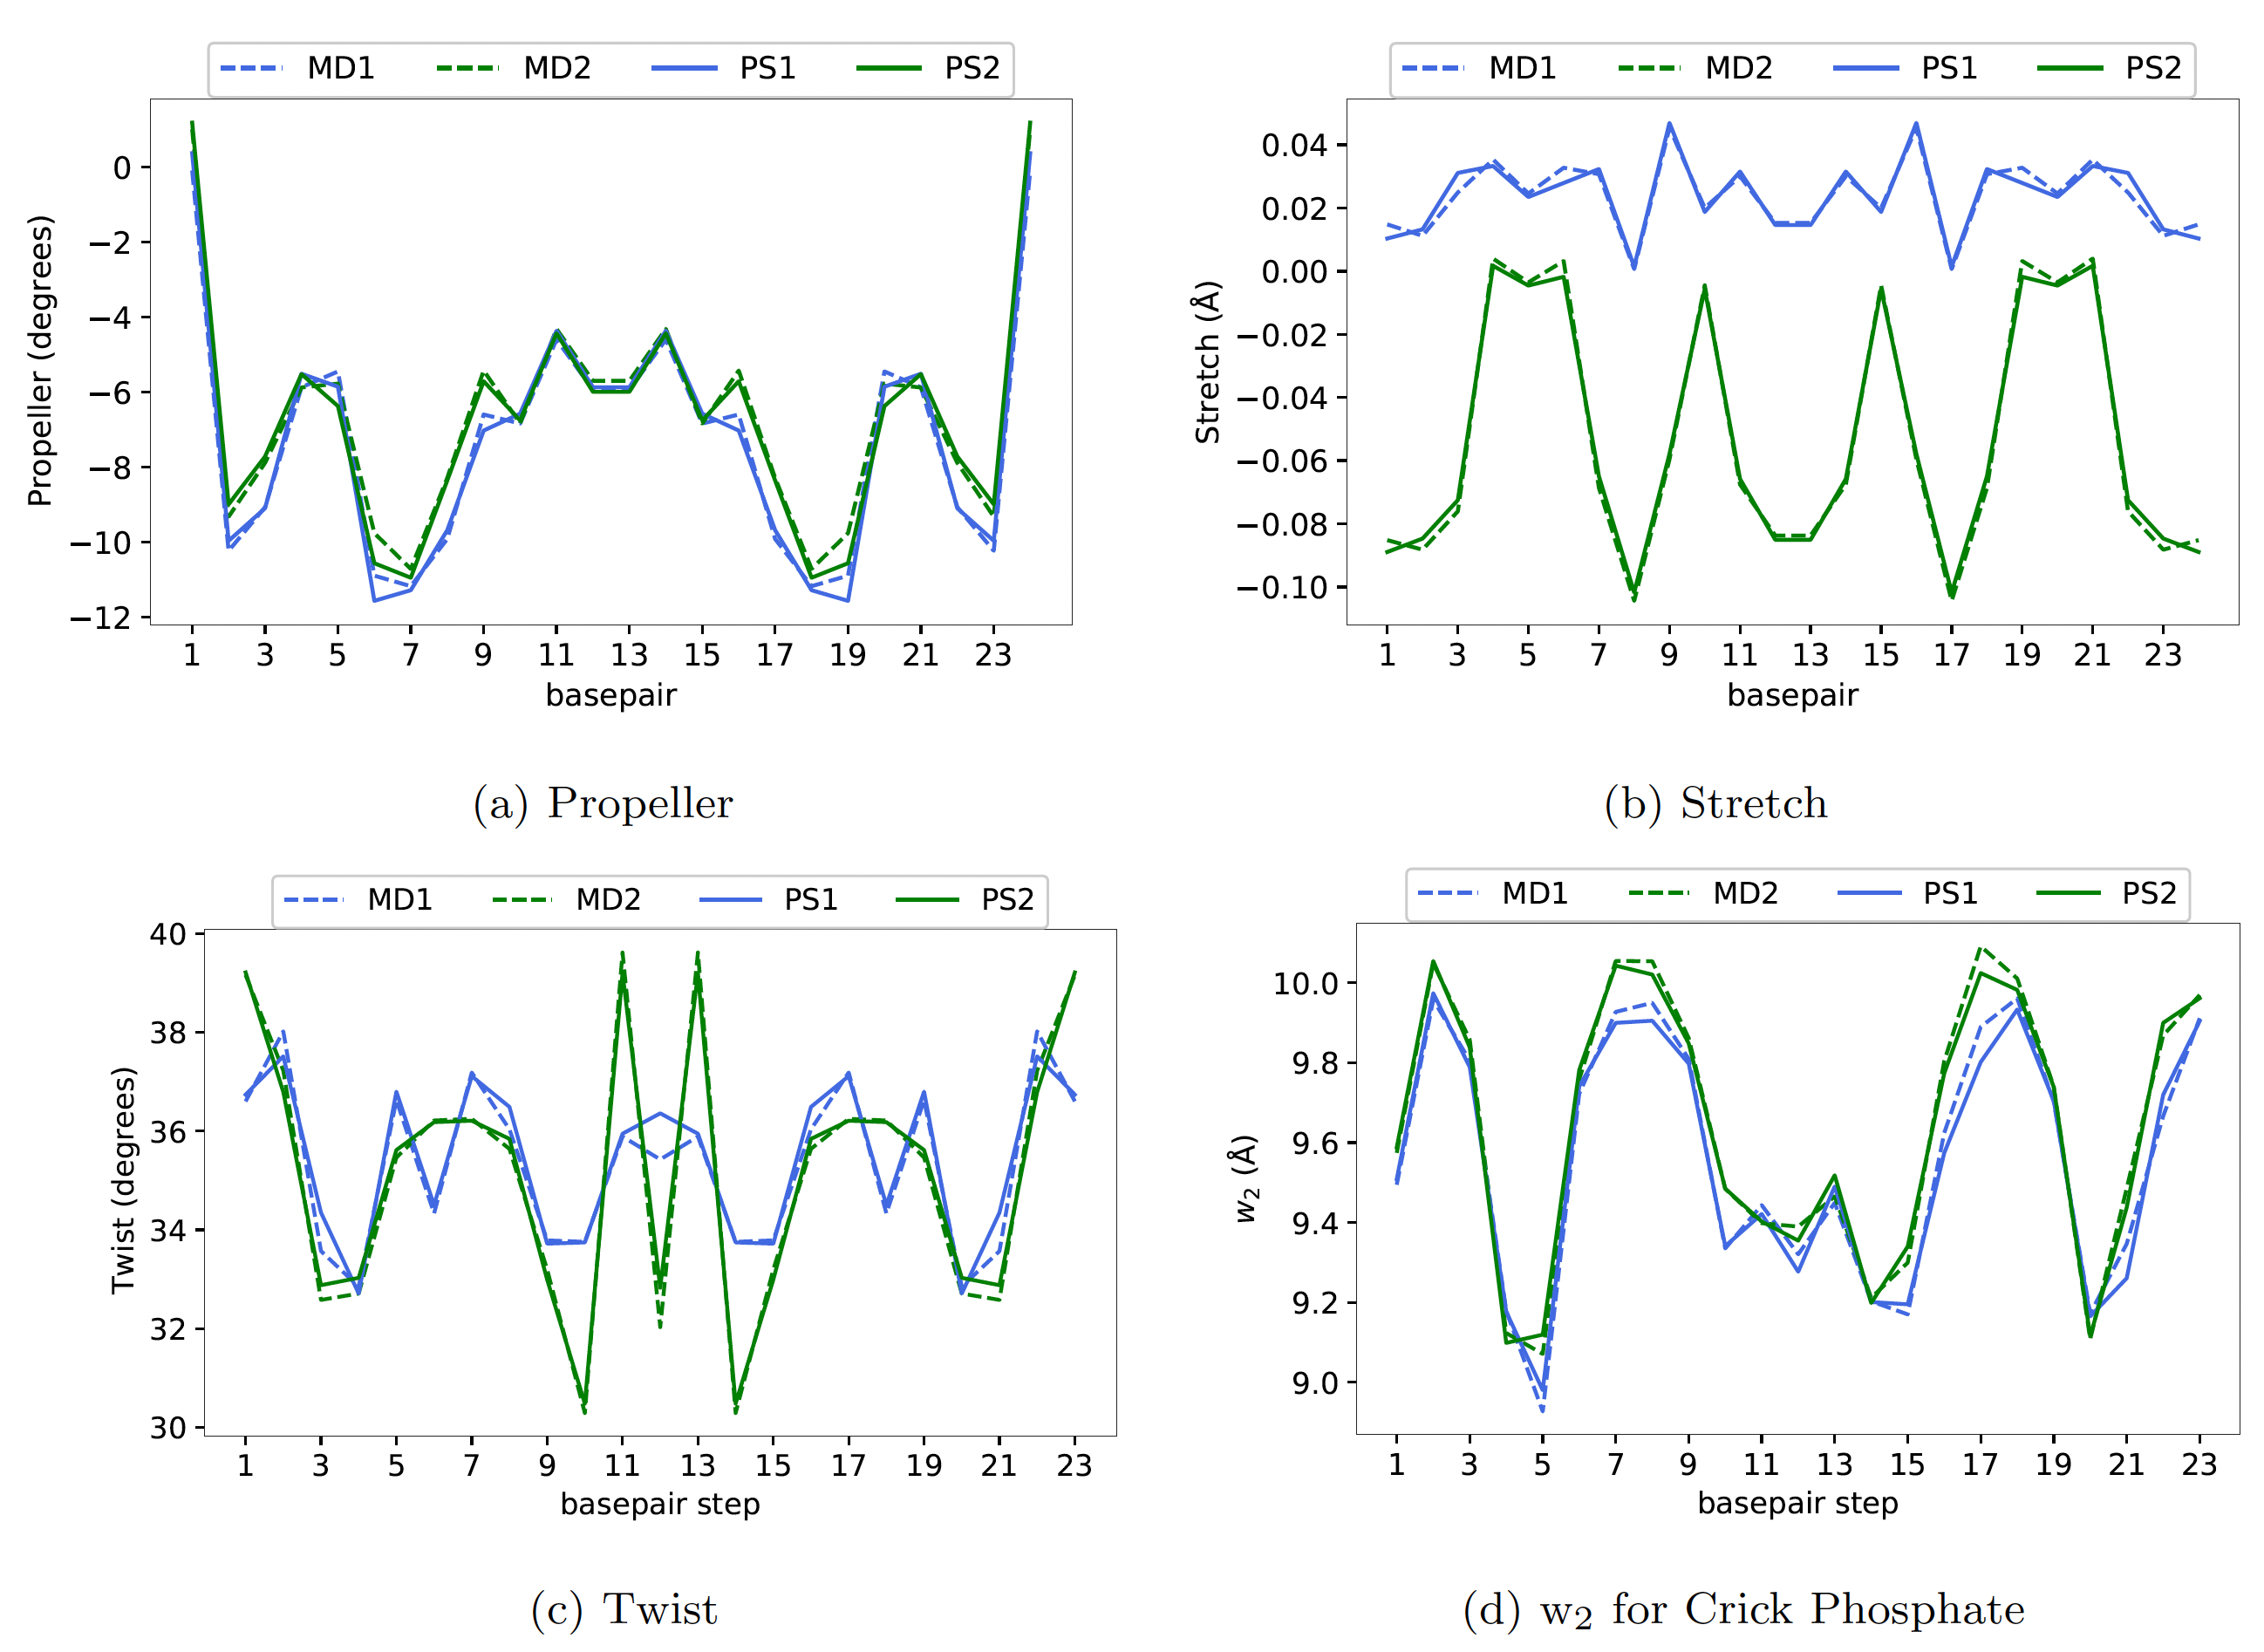
Figure 2 Plots of (a) Propeller, (b) Stretch, (c) Twist, and (d) w2 for Crick Phosphate
for a dsDNA sequence (GCCTAACCCTGCGCAGGGTTAGGC) along the average shape
observed in MD simulations using two different MD protocols (MD1 and MD2) and cgNA+
predictions for the two corresponding parameter sets PS1 and PS2. The differences for the
two protocols is larger than the error between cgNA+ predictions and MD observation.
Other coordinates similar.
More examples can be found in
cgNA+: A sequence-dependent coarse-grain model of double-stranded nucleic acids.
R. Sharma, EPFL Thesis #9792, Under the supervision of J. H. Maddocks
Download the PDF here.
cgNA+ vs cgDNA
The cgNA+ coarse-grain model is a finer-grain evolution from the prior cgDNA coarse-grain model. The cgDNA model did not include an explicit treatment of the phosphate groups i.e. it predicts the sequence-dependent Gaussian pdf in base coordinates only. Along with a finer description (both phosphate and base) of the dsNA, the cgNA+ model better captures the underlying MD statistics for base coordinates, as shown in figures below (taken from A. Patelli's thesis).
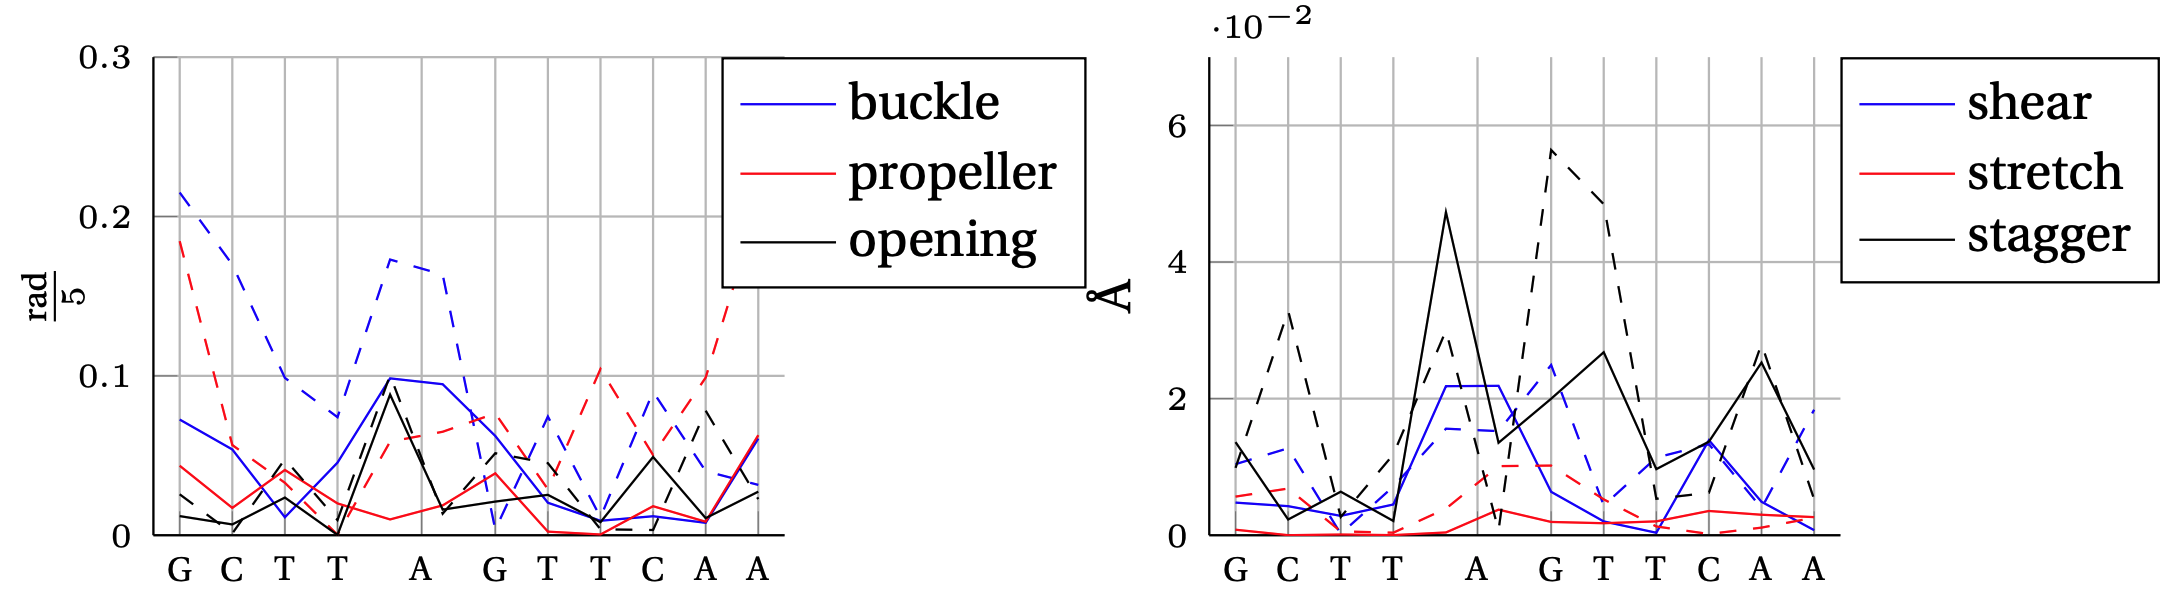
Absolute error between model predicted intra–base–pair degree of freedom and MD observation.
In solid, we show the error obtained by the cgNA+ model (DNA PS1) and in dashed line the error obtained by the cgDNA (old) model.
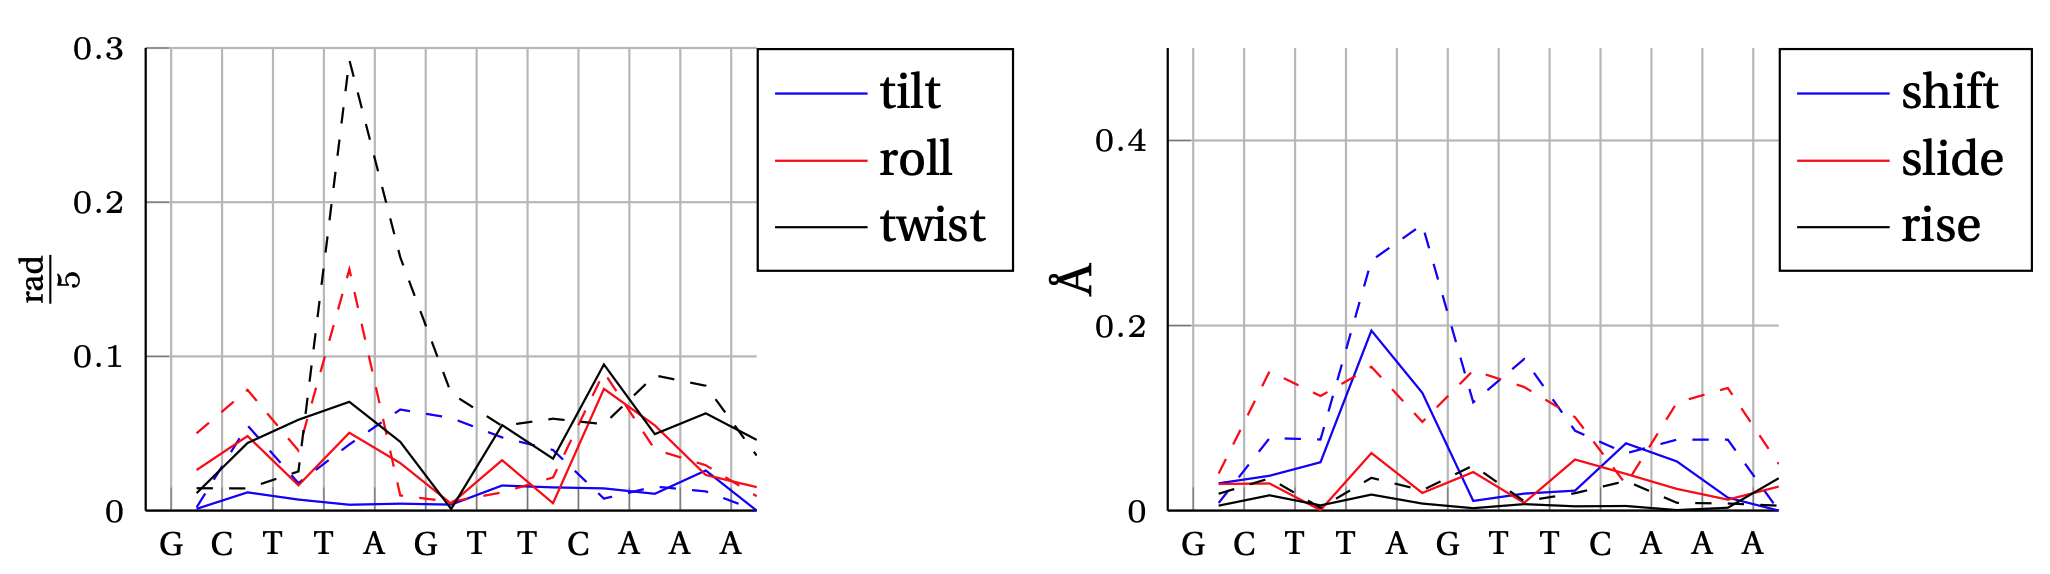
Absolute error between model predicted inter–base–pair degree of freedom and MD observation.
In solid, we show the error obtained by the cgNA+ model (DNA PS1) and in dashed line the error obtained by the cgDNA (old) model.
Stiffness matrices
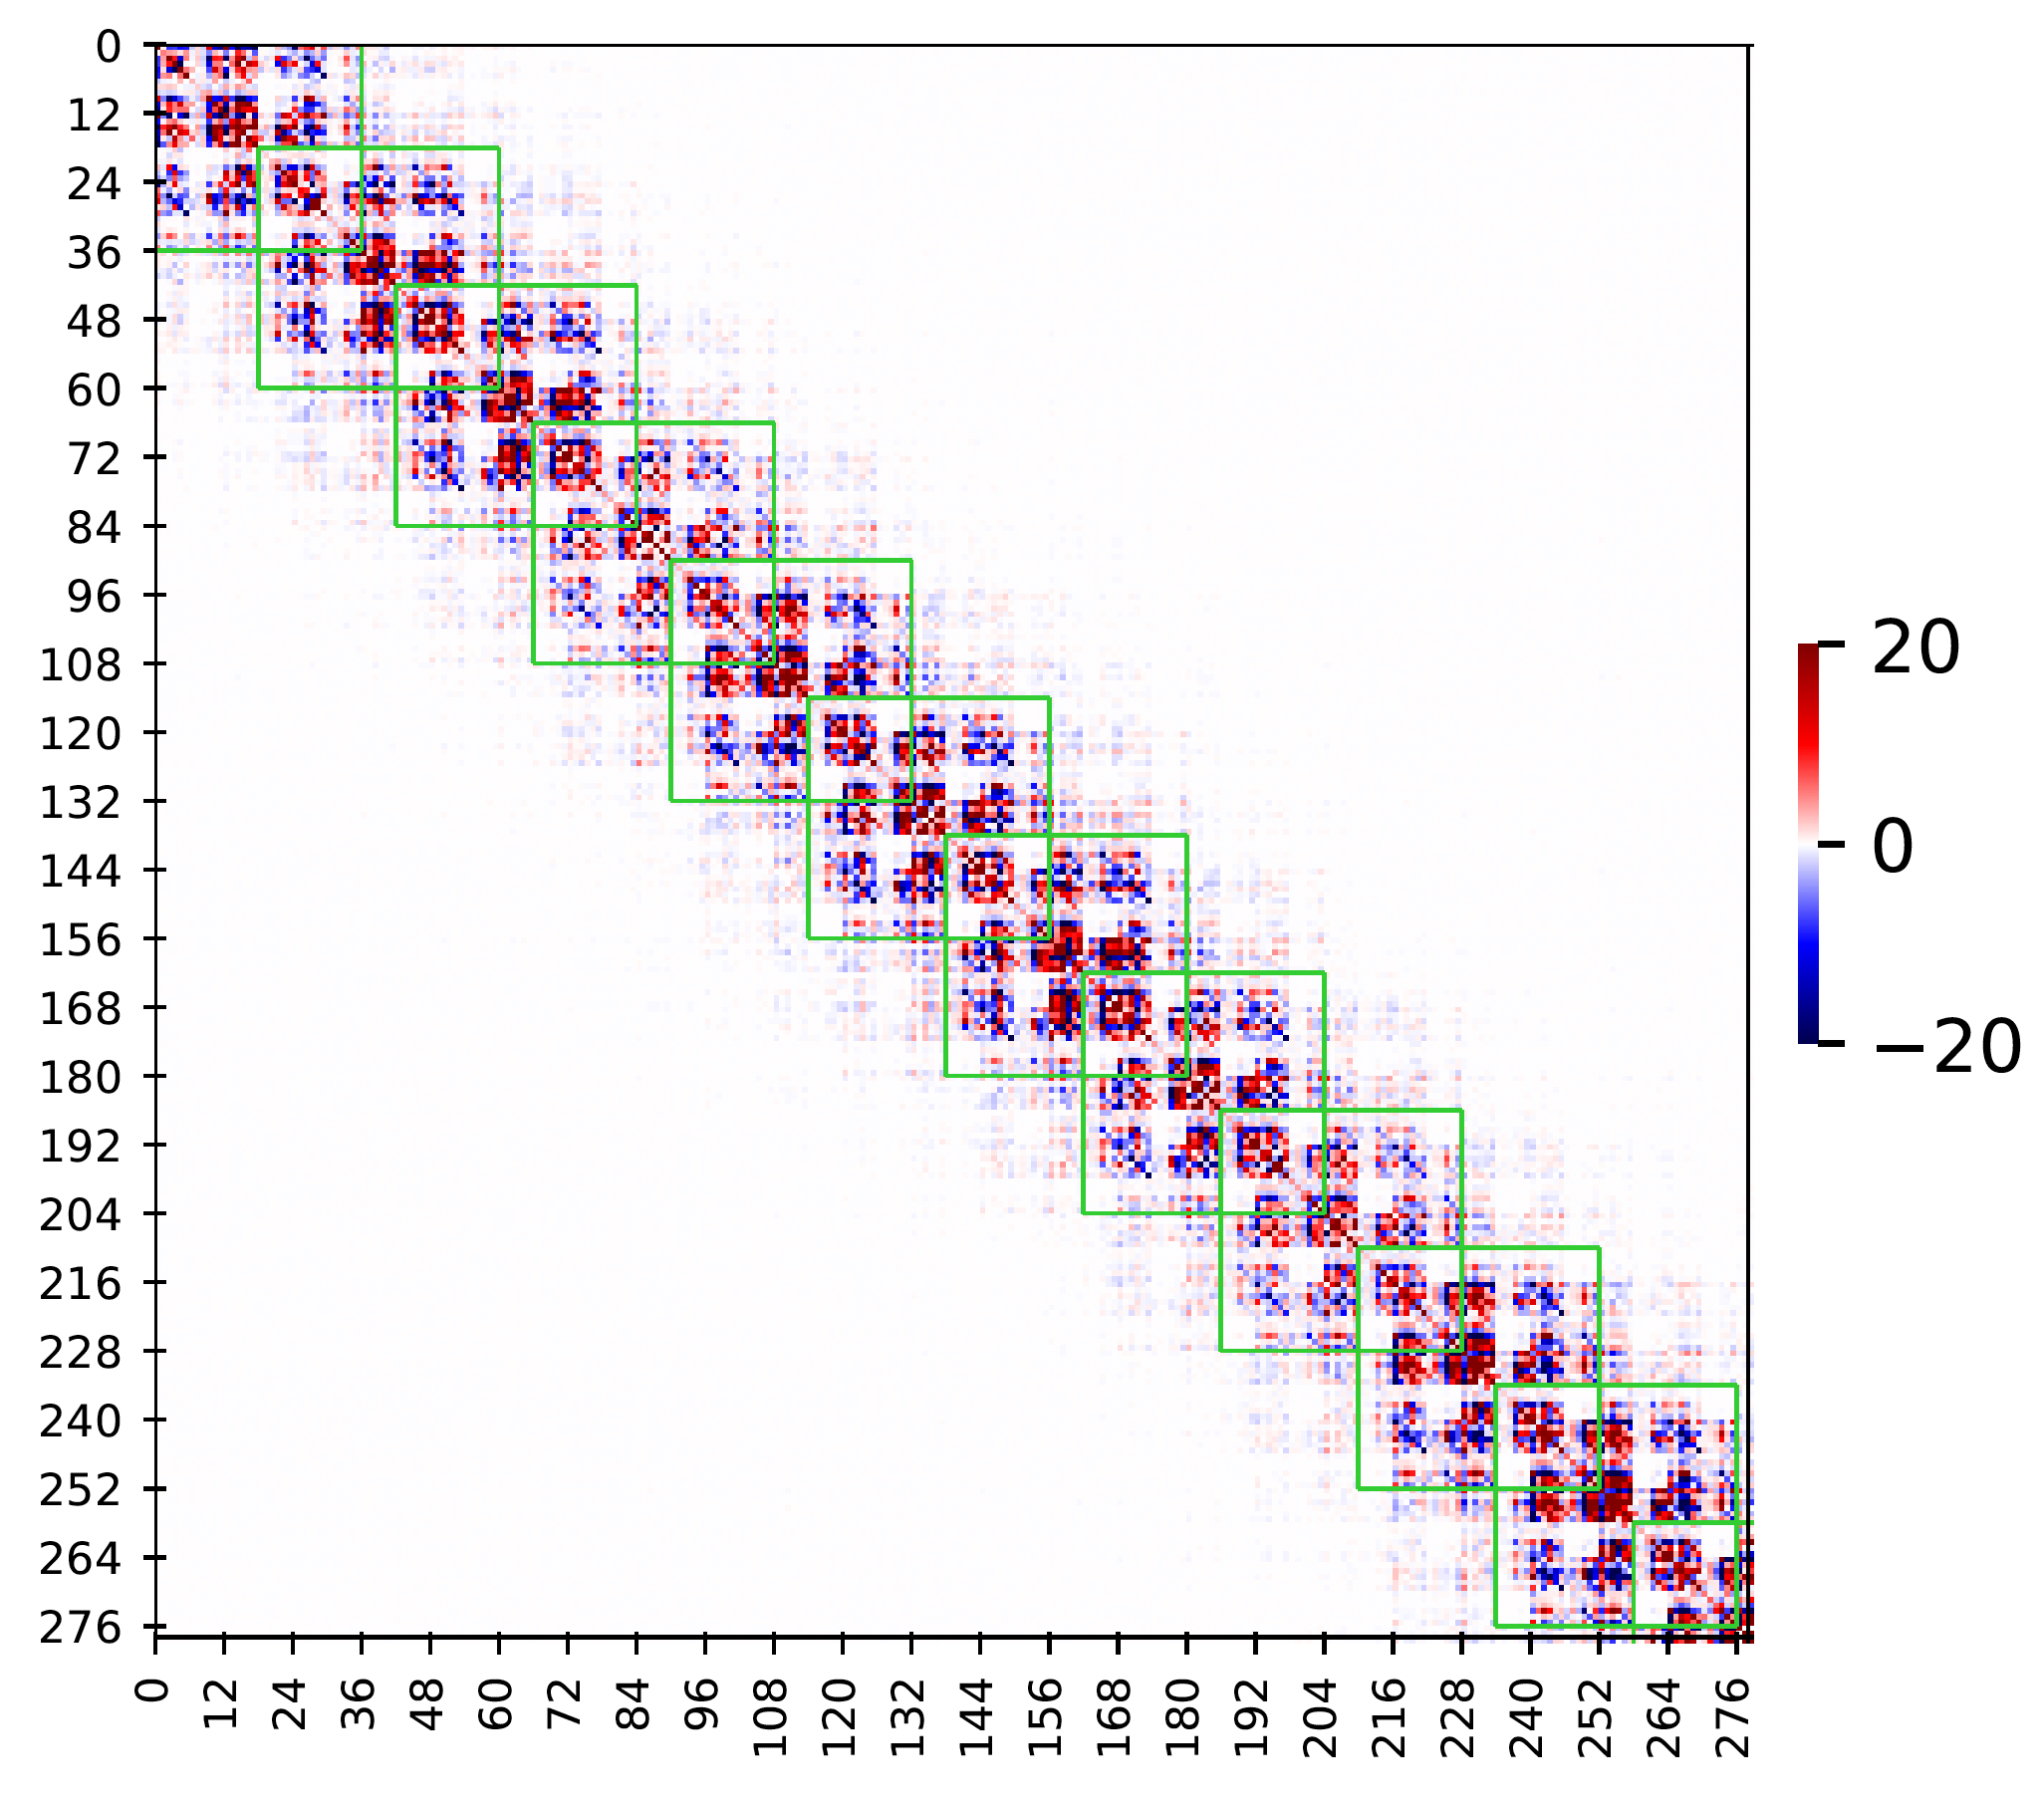
Figure 3
Sparsity pattern in observed stiffness matrix in MD simulation of a dsDNA sequence GCTTAGTTCAAATTTGAACTAAGC
(only half sequence is shown as the sequence is a palindrome).
The green stencils correspond to the nearest-neighbor interactions approximation.
The dimension of the stiffness matrix is 558 X 558 (24n-18 where n=24 for this sequence) and x and y labels are the coordinate index.
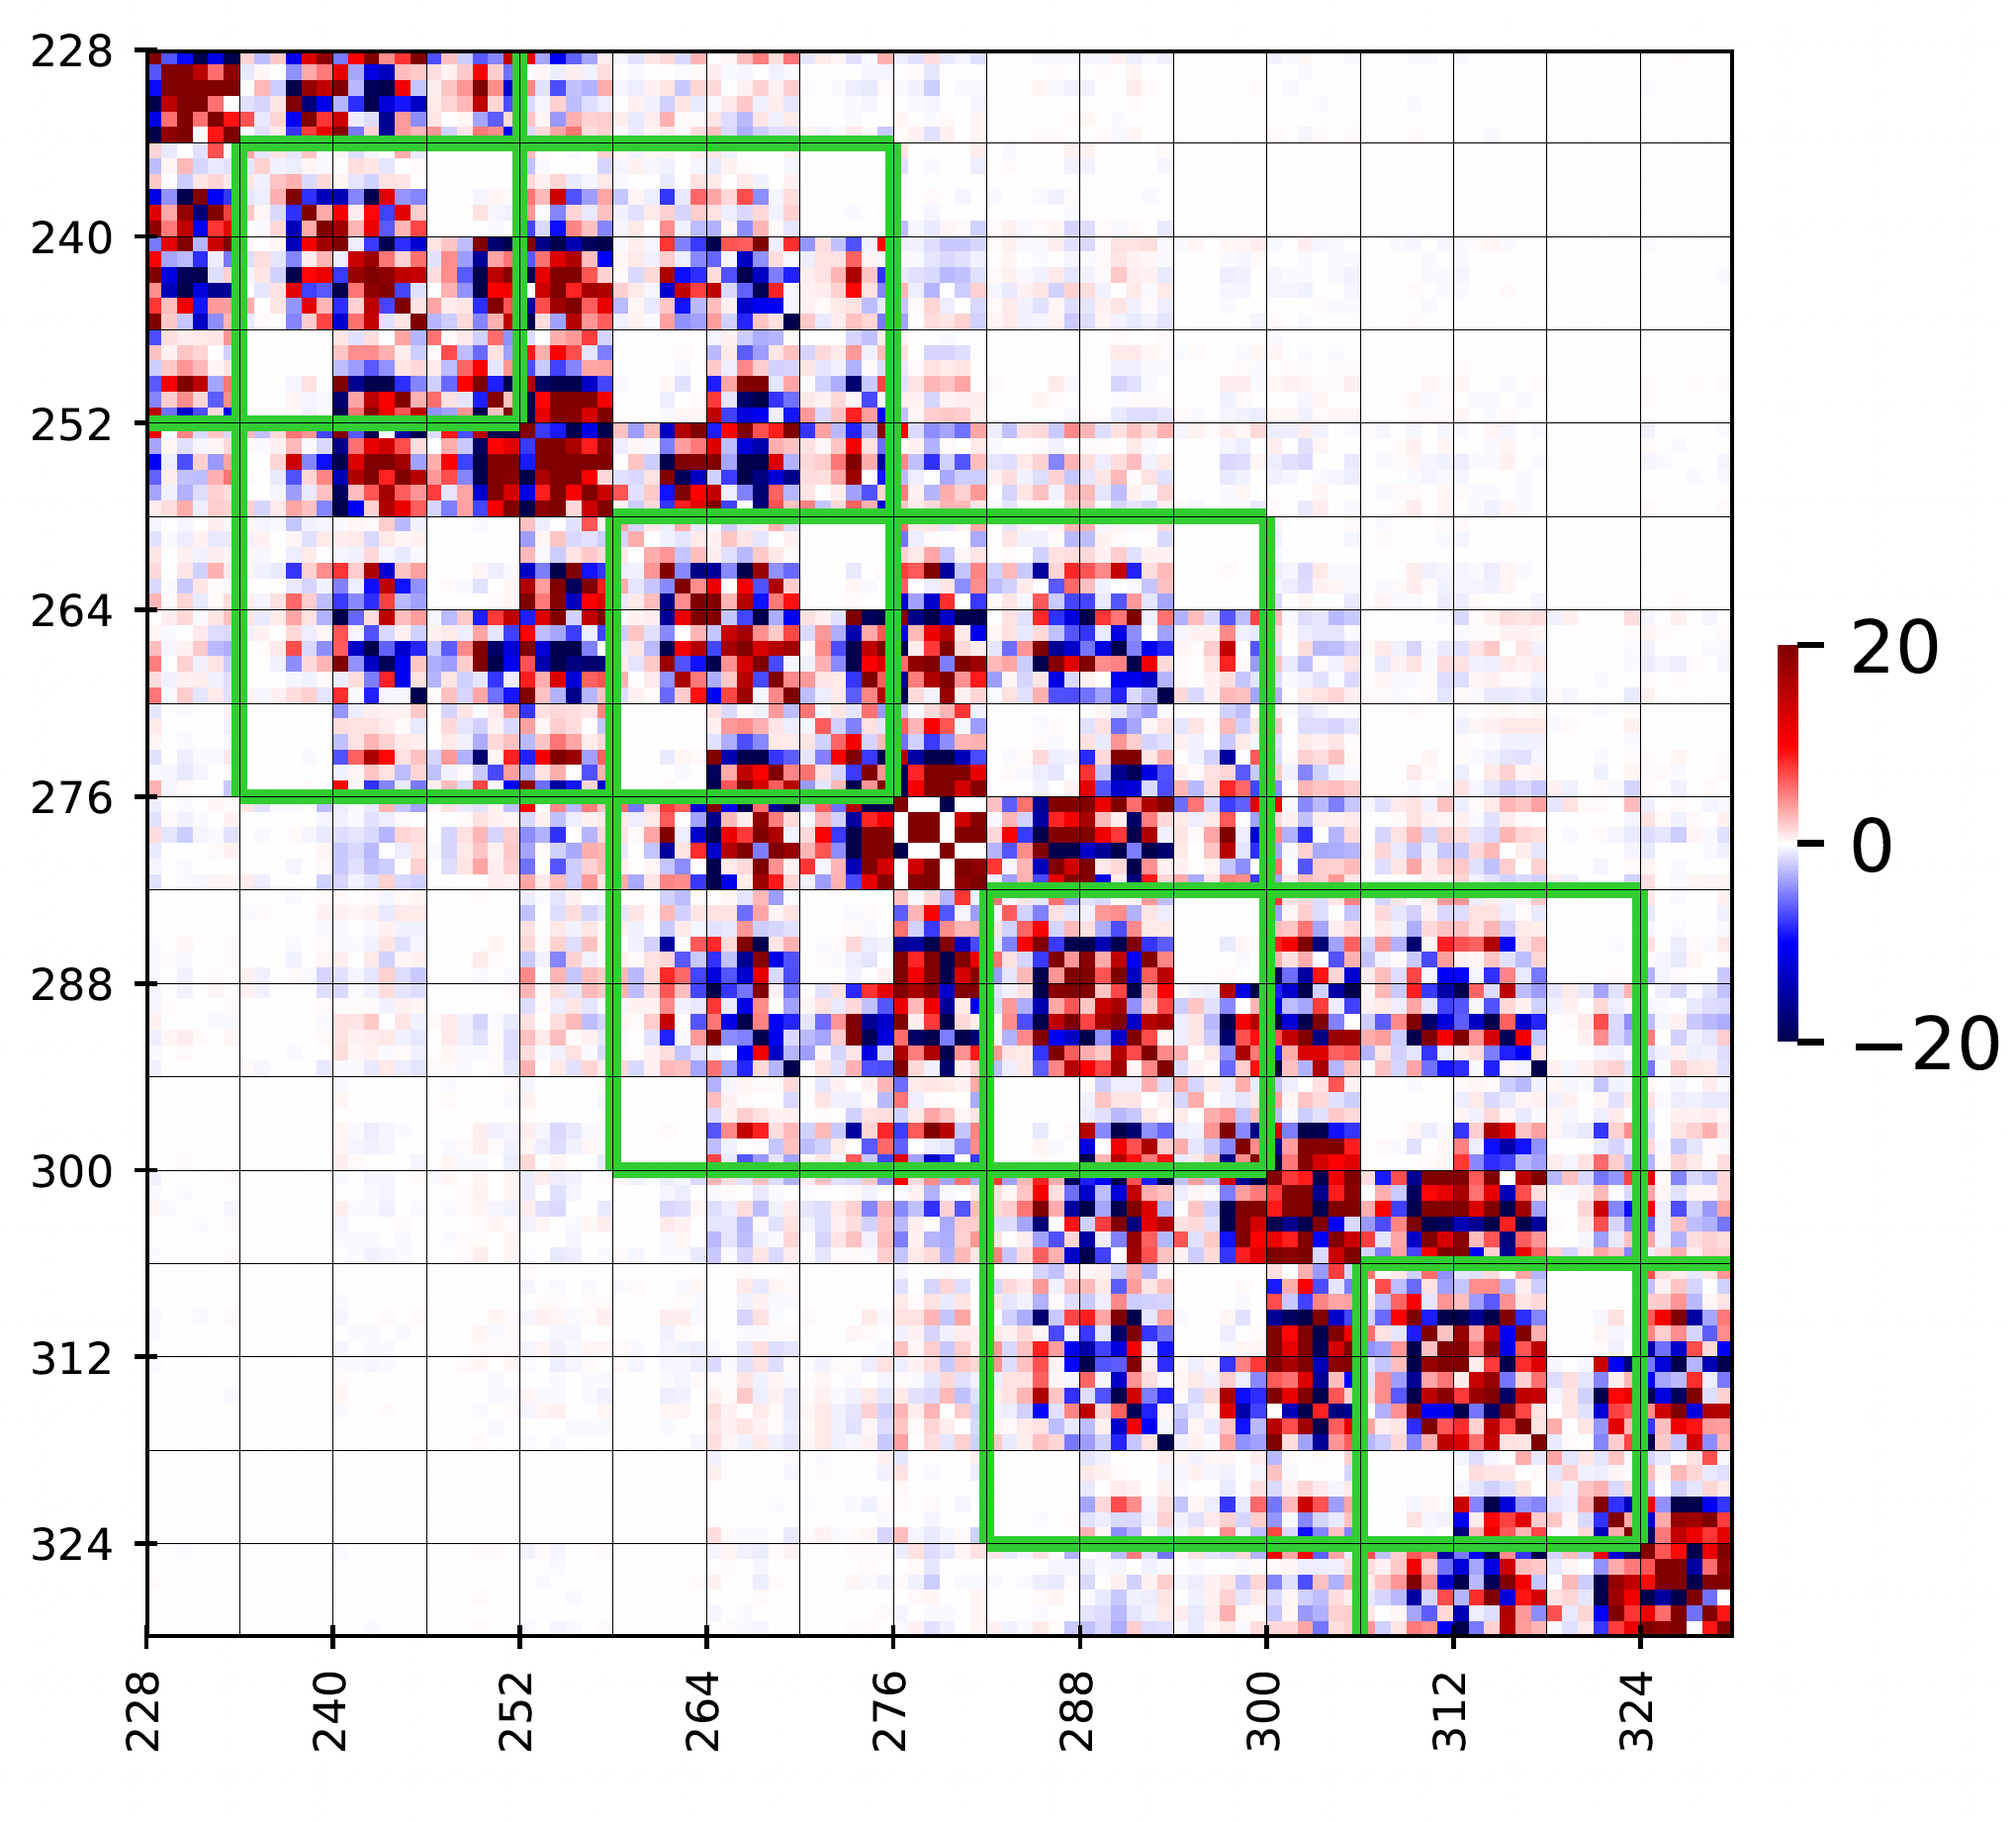
Figure 4
Zoom-in image of the above matrix corresponding to the central tetramer. The green stencils
correspond to the nearest-neighbor interactions approximation.
The cgNA+ model predicts both a ground state configuration and a banded stiffness matrix for each input sequence.
However cgNA+web focuses on visualising the ground state shape in various ways, and only
provides the stiffness matrix via download of a file with its numerical entries. This data may then be post-processed as wished.
One possibility is to make plots of the eigenvalues of the stiffness matrix, as indicated in the figure below
(in the scaling with translation variables in Angstroms and rotations in 1/5th radians).
Another is to download and use the .txt ground state shape and associated .csc/.json stiffness matrix as inputs
to a Monte Carlo simulation code for sampling the cgNA+ Gaussian PDF in order to compute various expectations of interest,
e.g. sequence-dependent persistence lengths as described in [6].
However, for extensive post-processing simulations it is probably more efficient to install and use the
available cgNA+ Matlab/Octave or
Python scripts directly rather than using the cgNA+web interface.
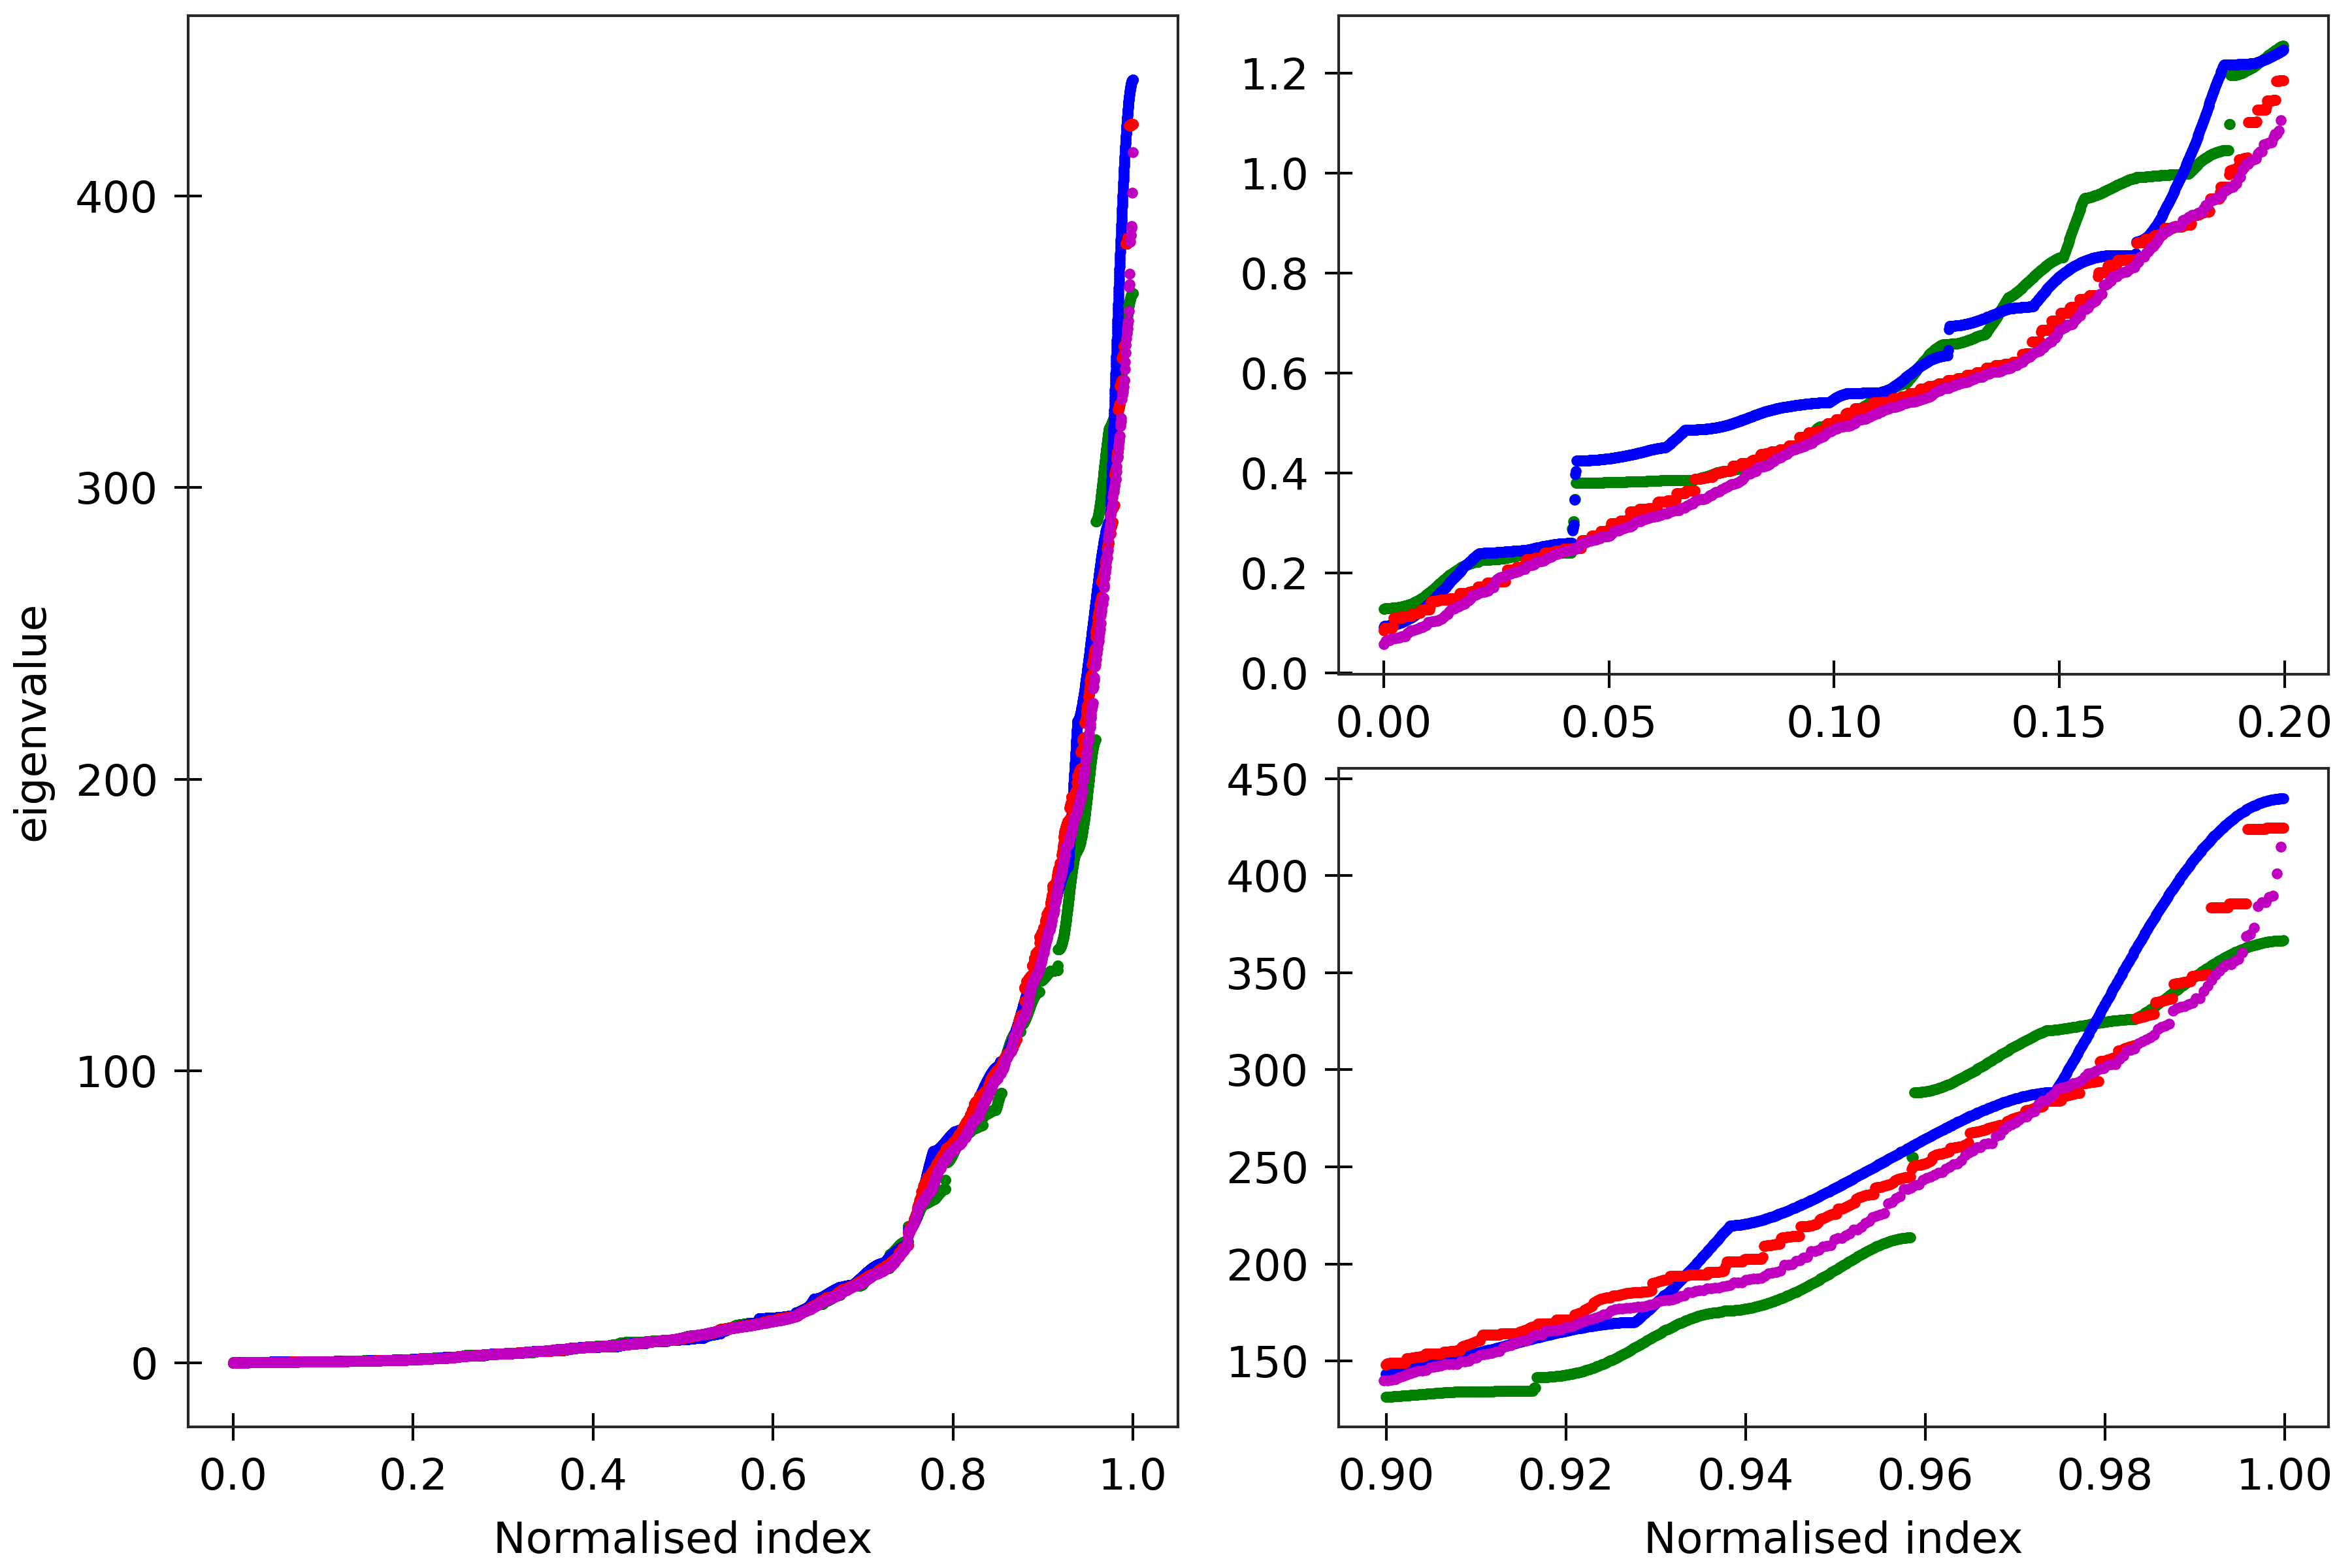
Figure 5
The cgNA+ stiffness matrix for a sequence of length n has 24n-18 eigenvalues, all
real and positive, which can be sorted in ascending order and plotted against their index
(scaled to always lie in [0,1] to facilitate comparison of spectra for sequences of different
lengths). Spectra (computed using ‘DNA PS2’ parameter set) are here compared for four
dsDNA sequences A_300 (blue), (AT)_150 (green), the Widom 601 positioning sequence
(magenta) and the A-tract sequence (A_5G_5T_5C_5T)_15 (red). All the sequences are taken in GC ends.
The two insets on the right
are magnifications of the lower and upper parts of the spectra.
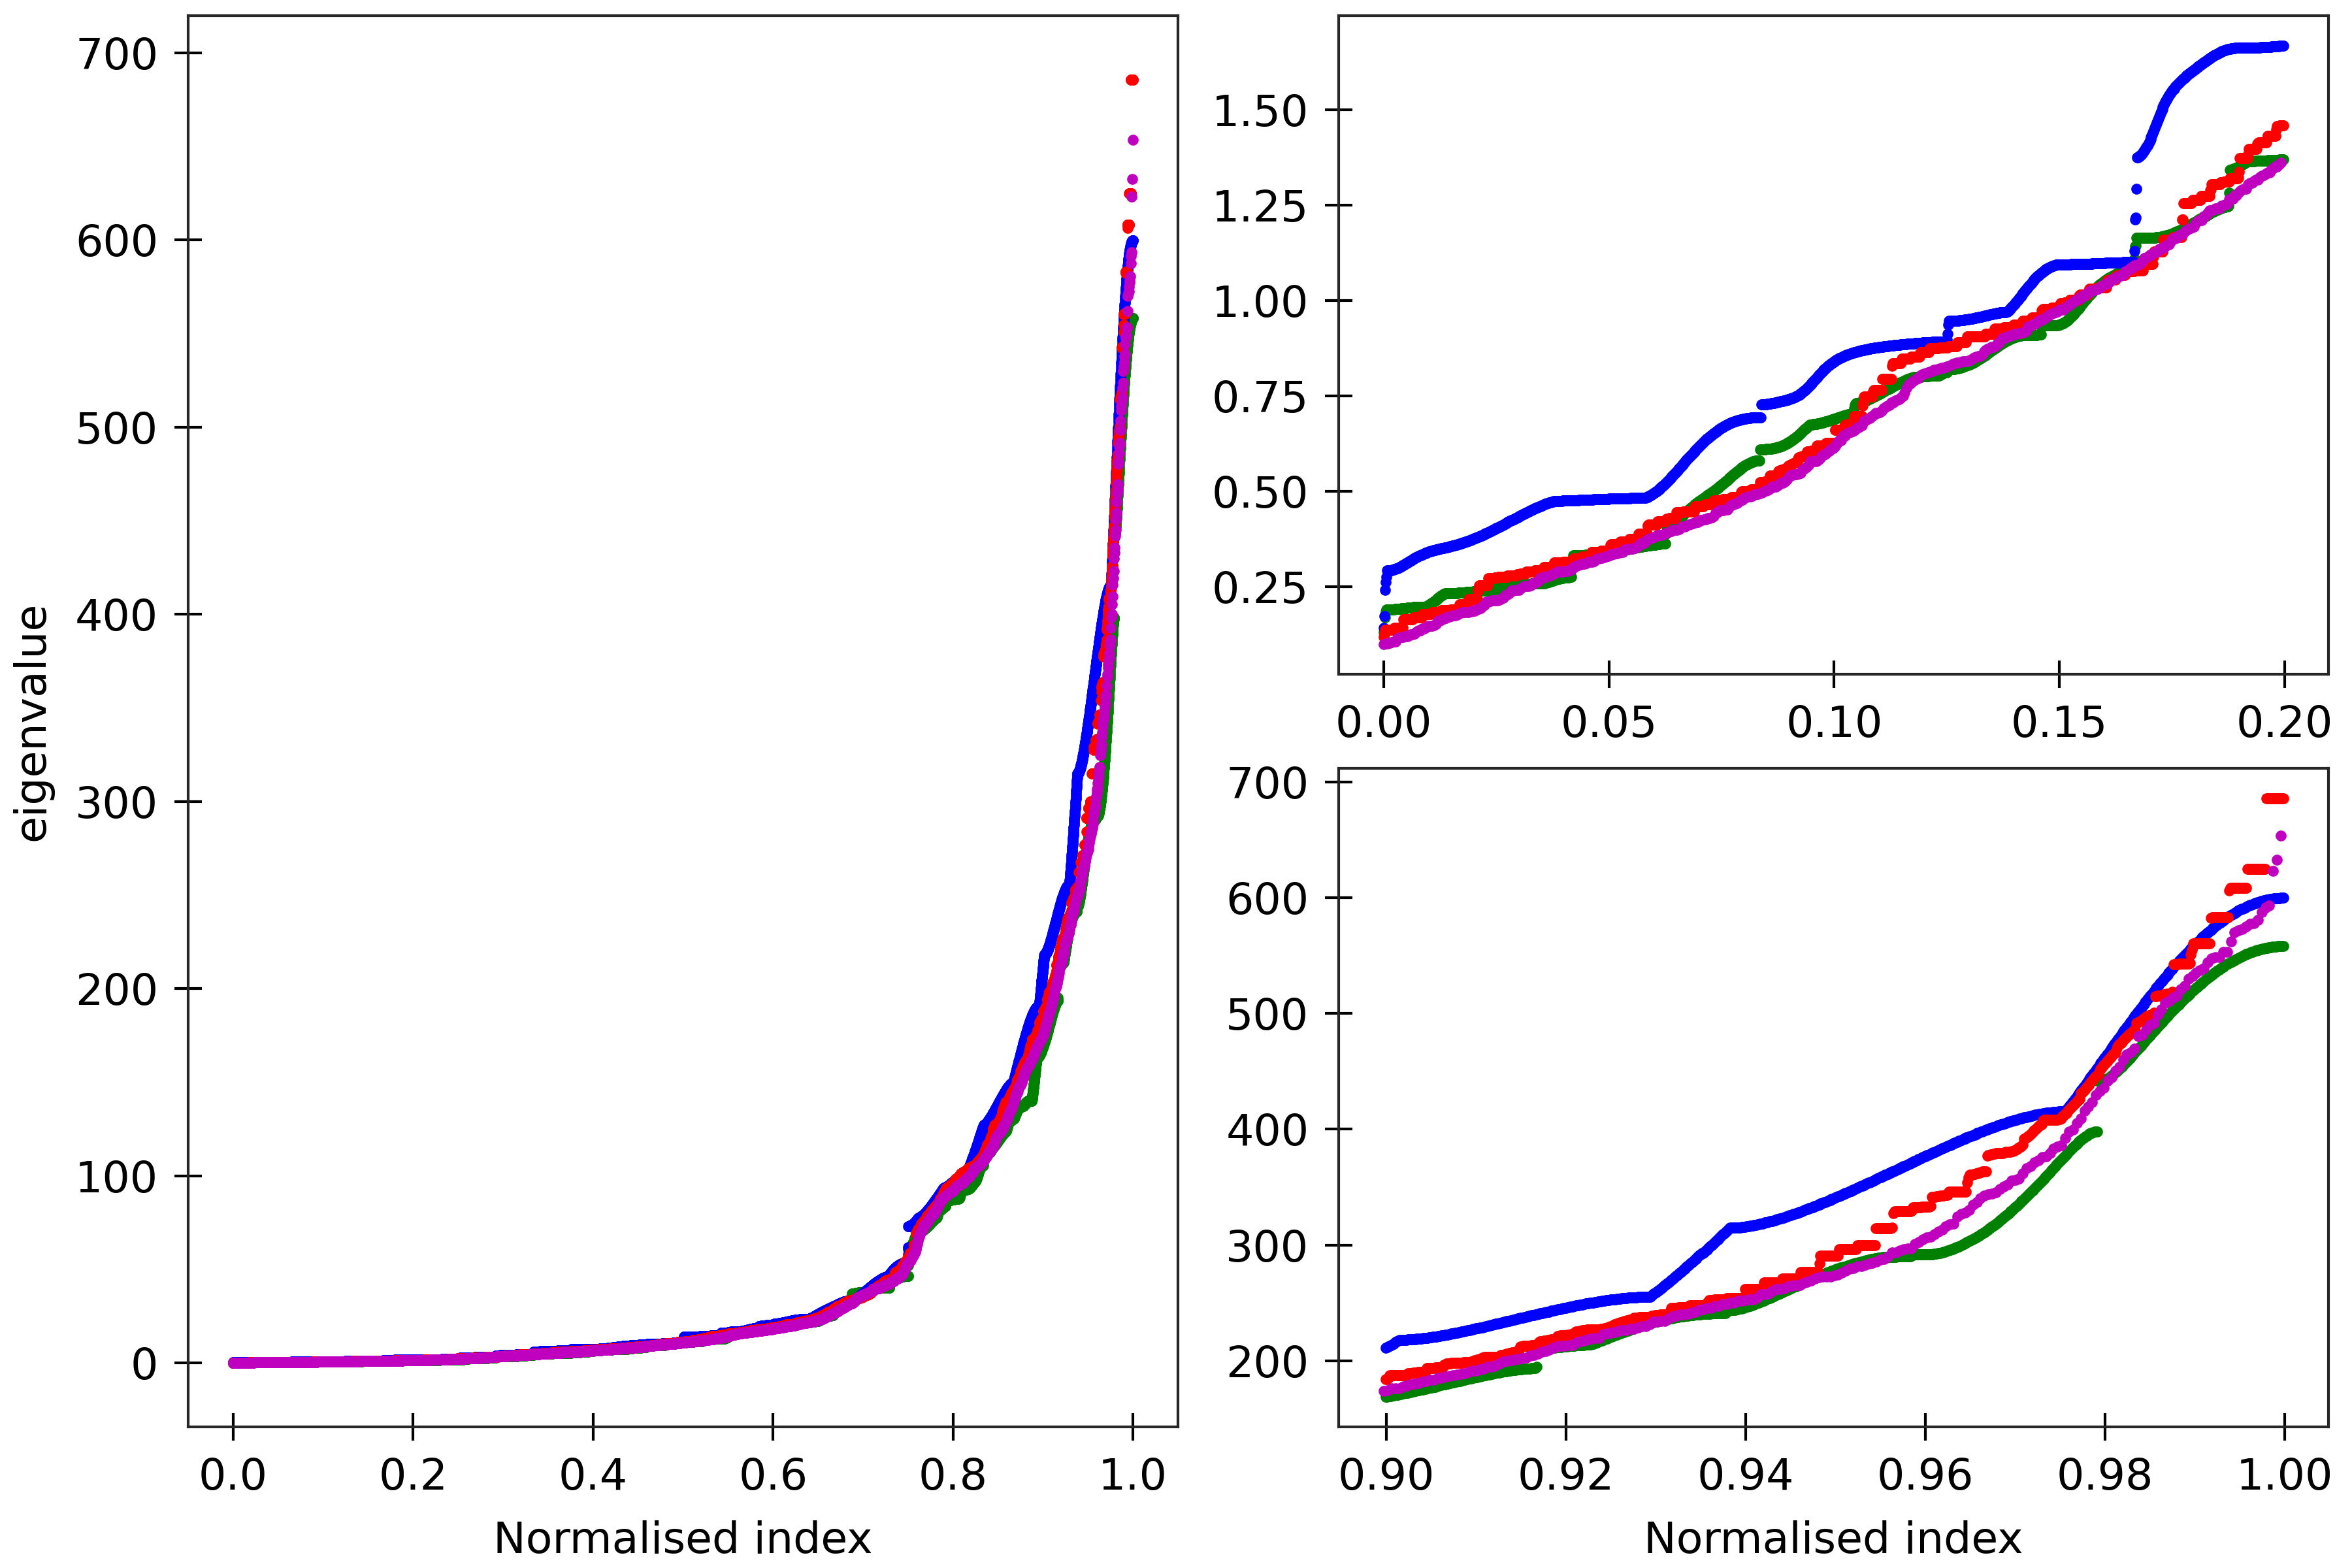
Figure 6
The cgNA+ stiffness matrix for a sequence of length n has 24n-18 eigenvalues, all
real and positive, which can be sorted in ascending order and plotted against their index
(scaled to always lie in [0,1] to facilitate comparison of spectra for sequences of different
lengths). Spectra (computed using ‘DRH PS2’ parameter set) are here compared for
four DRH sequences A_300 (blue), (AT)_150 (green), the Widom 601 positioning sequence
(magenta) and the A-tract sequence (A_5G_5T_5C_5T)_15 (red). All the sequences are taken in GC ends.
The two insets on the right
are magnifications of the lower and upper parts of the spectra.
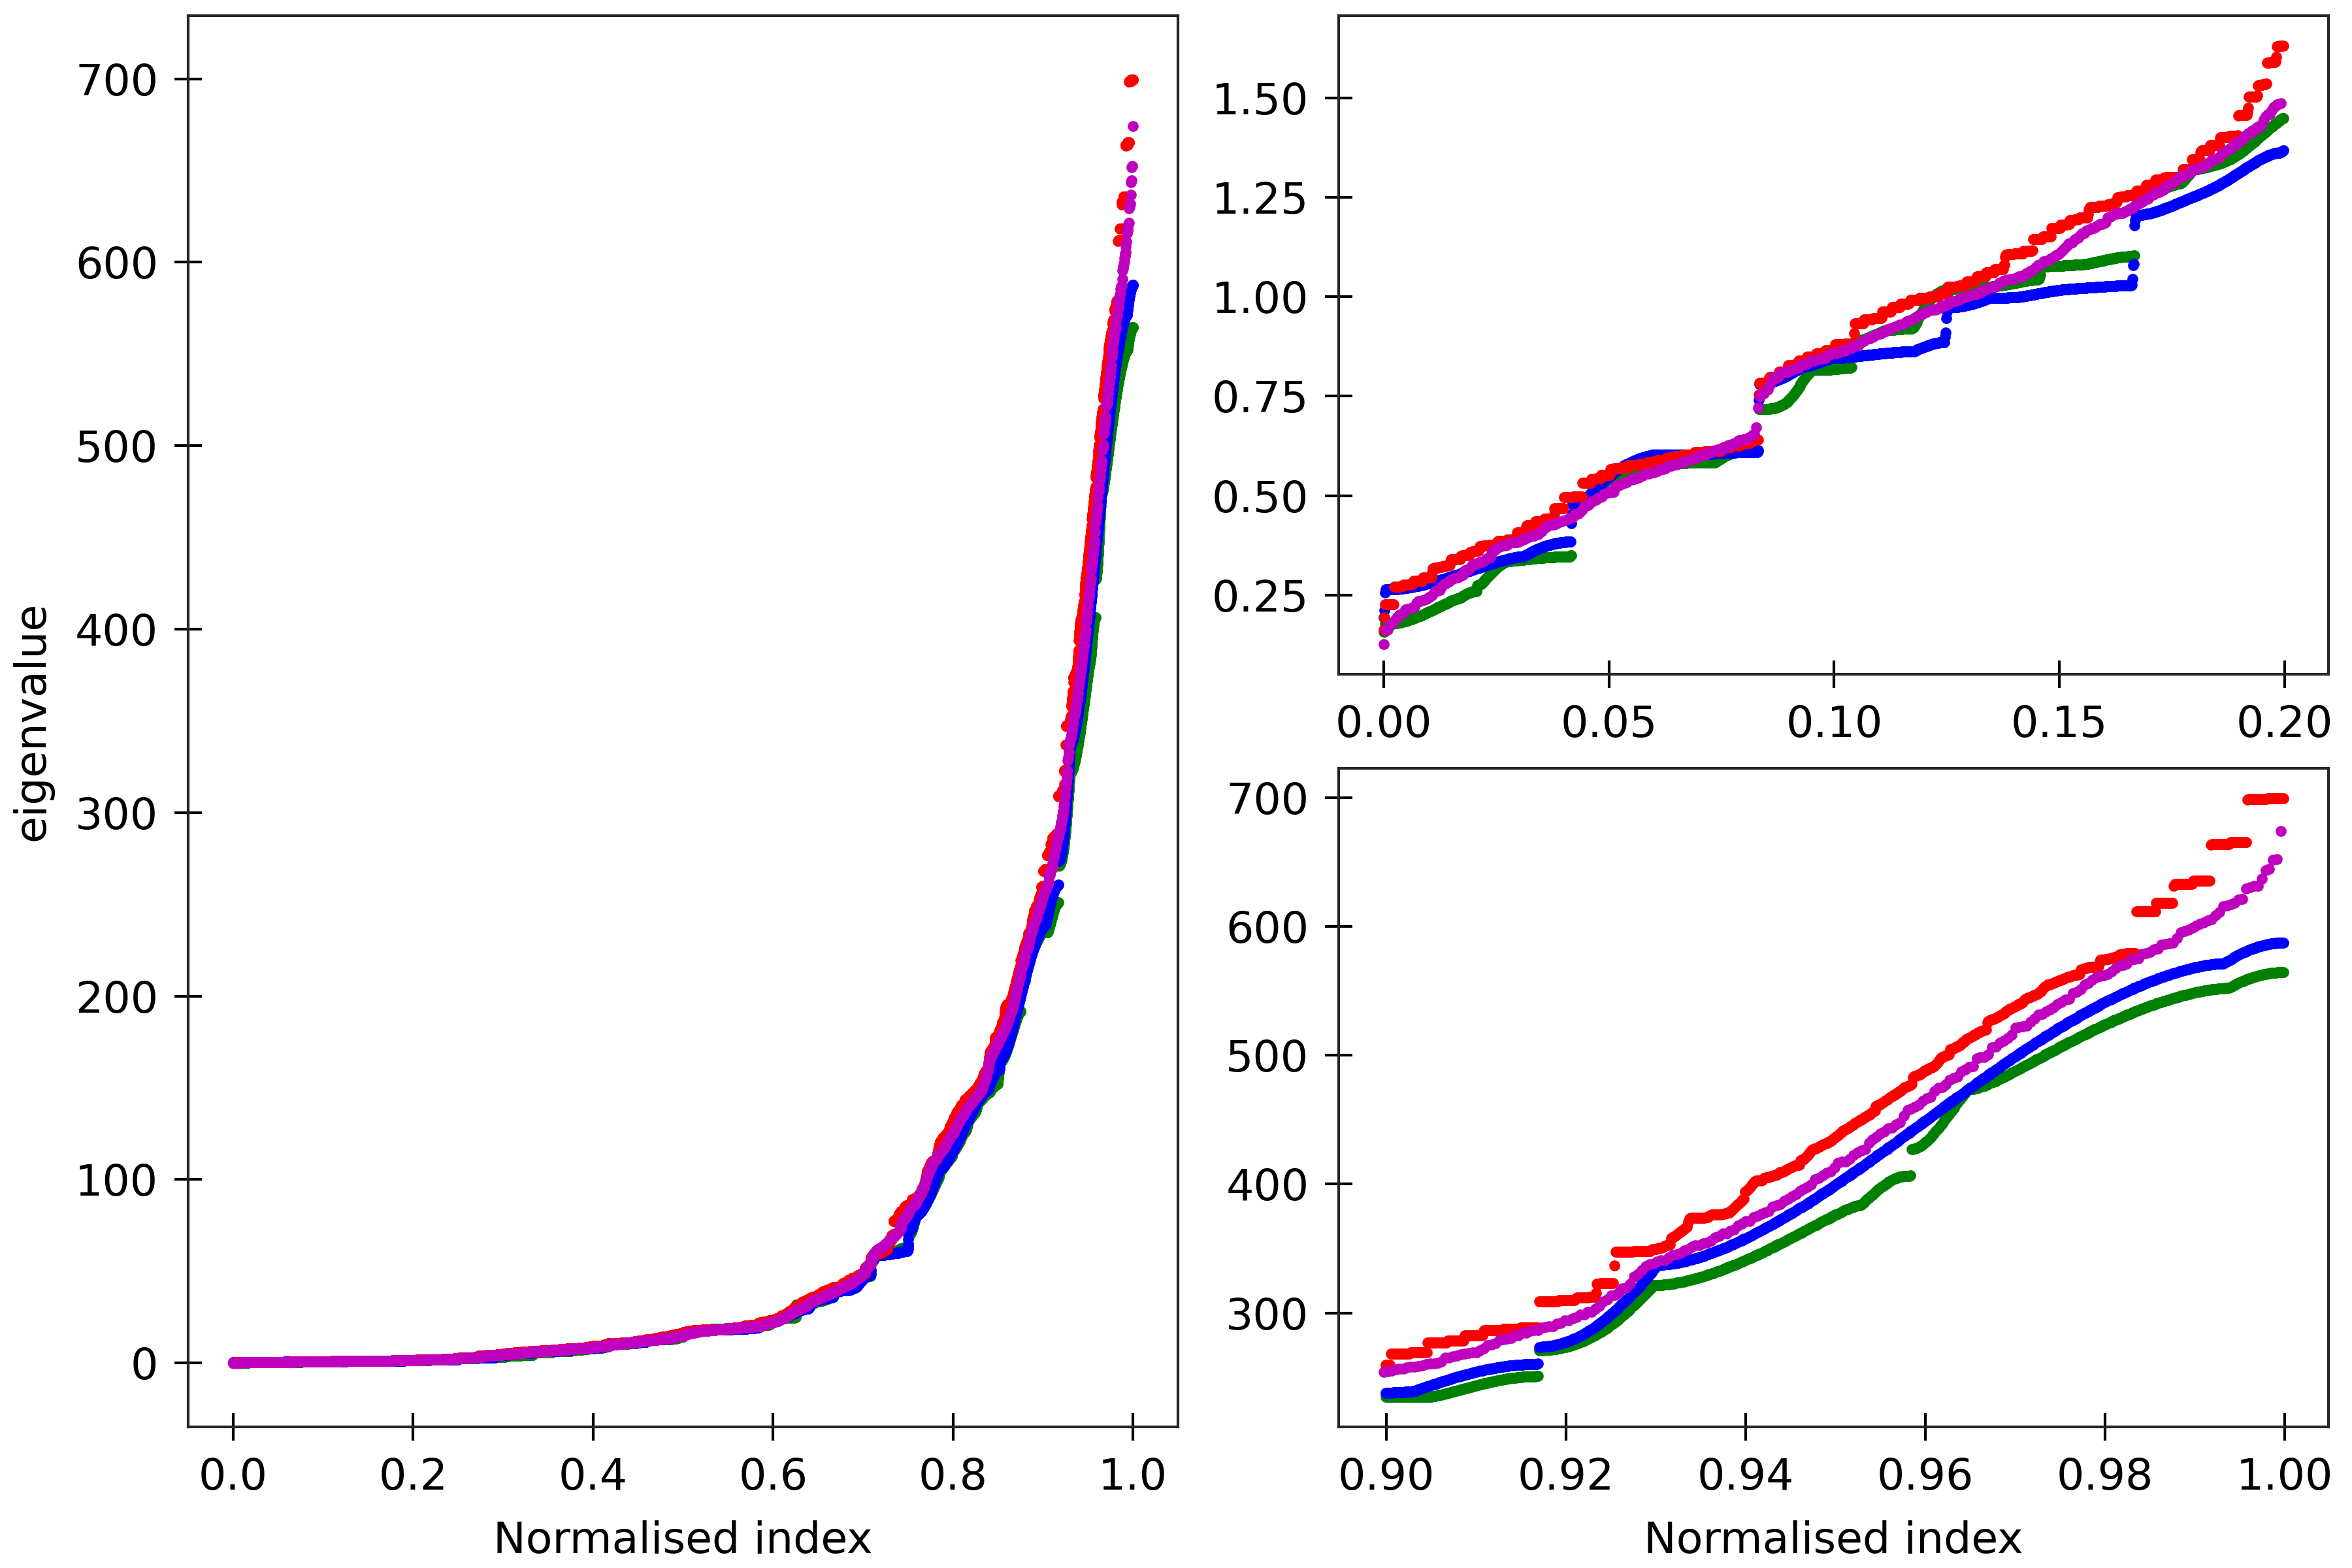
Figure 7
The cgNA+ stiffness matrix for a sequence of length n has 24n-18 eigenvalues, all
real and positive, which can be sorted in ascending order and plotted against their index
(scaled to always lie in [0,1] to facilitate comparison of spectra for sequences of different
lengths). Spectra (computed using ‘RNA PS2’ parameter set) are here compared for four
dsRNA sequences A_300 (blue), (AU)_150 (green), the Widom 601 positioning sequence
(magenta) and the A-tract sequence (A_5G_5U_5C_5U)_15 (red). All the sequences are taken in GC ends.
The two insets on the right
are magnifications of the lower and upper parts of the spectra.
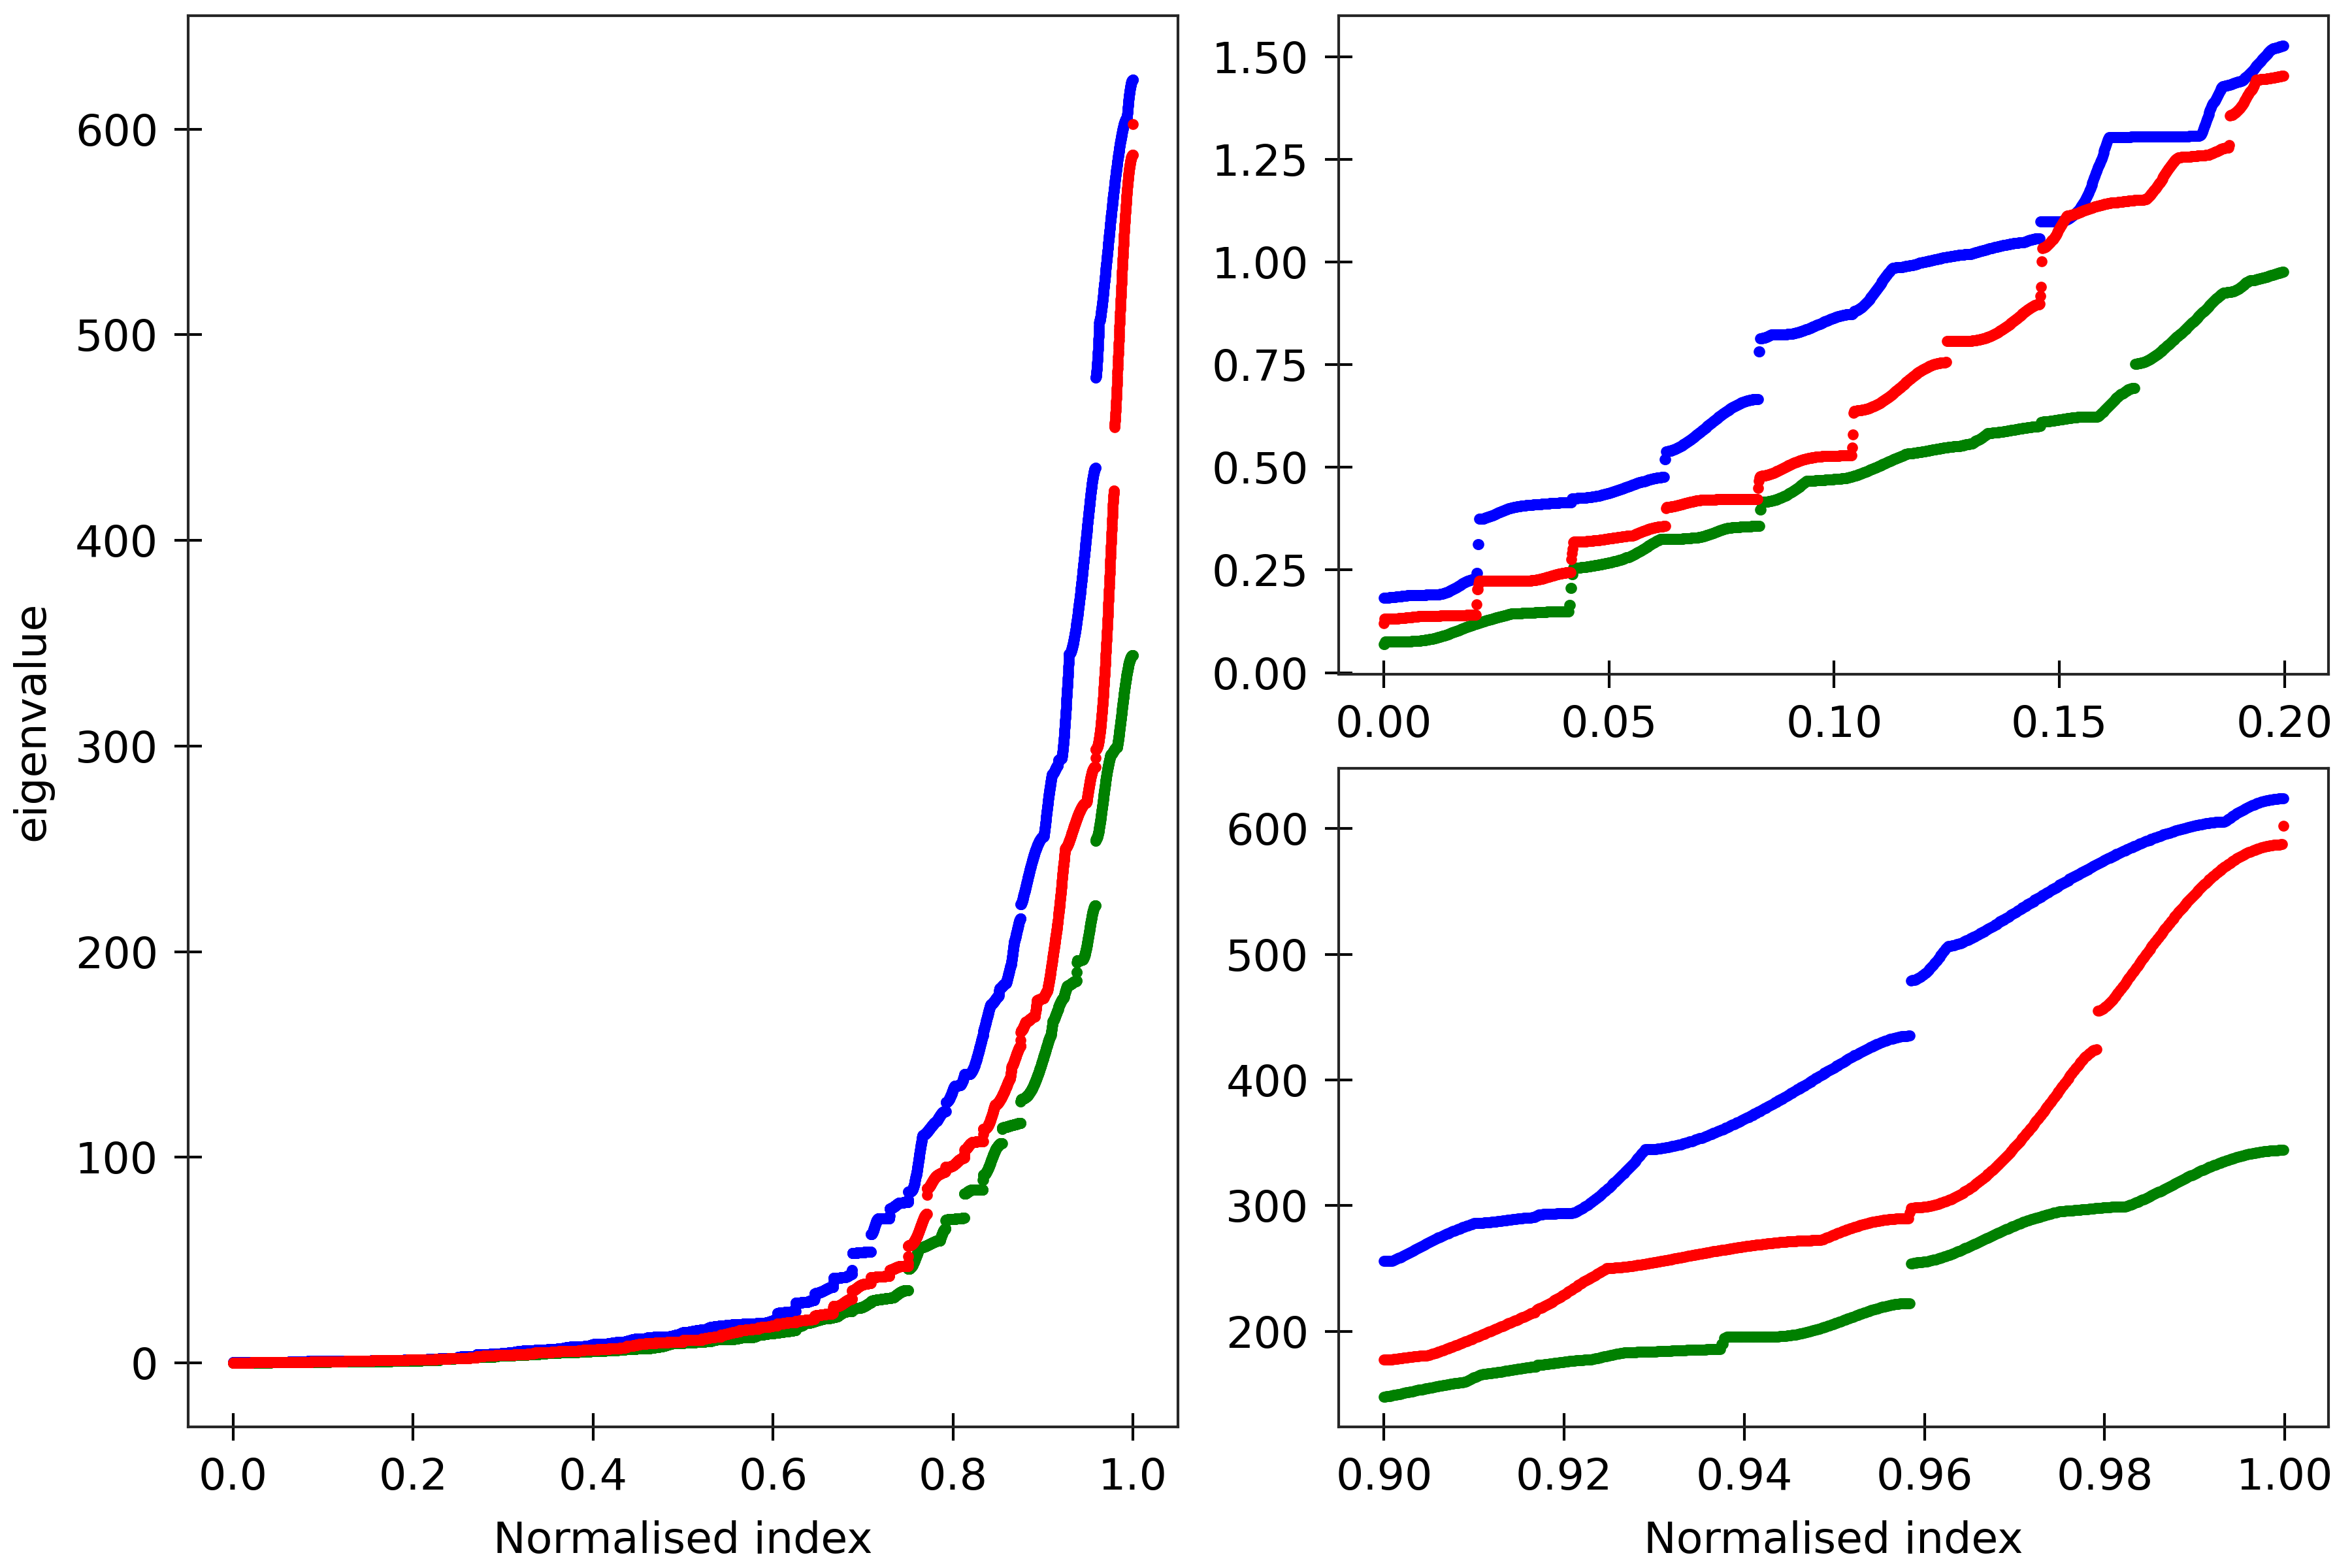
Figure 8
The cgNA+ stiffness matrix for a sequence of length n has 24n-18 eigenvalues, all
real and positive, which can be sorted in ascending order and plotted against their index
(scaled to always lie in [0,1] to facilitate comparison of spectra for sequences of different
lengths). Spectra are here compared for (CG)_150 for its dsDNA (DNA PS2, green), dsRNA
(blue), and DRH (red) versions. All the sequences are taken in GC ends.
The two insets on the right are magnifications of the lower
and upper parts of the spectra.
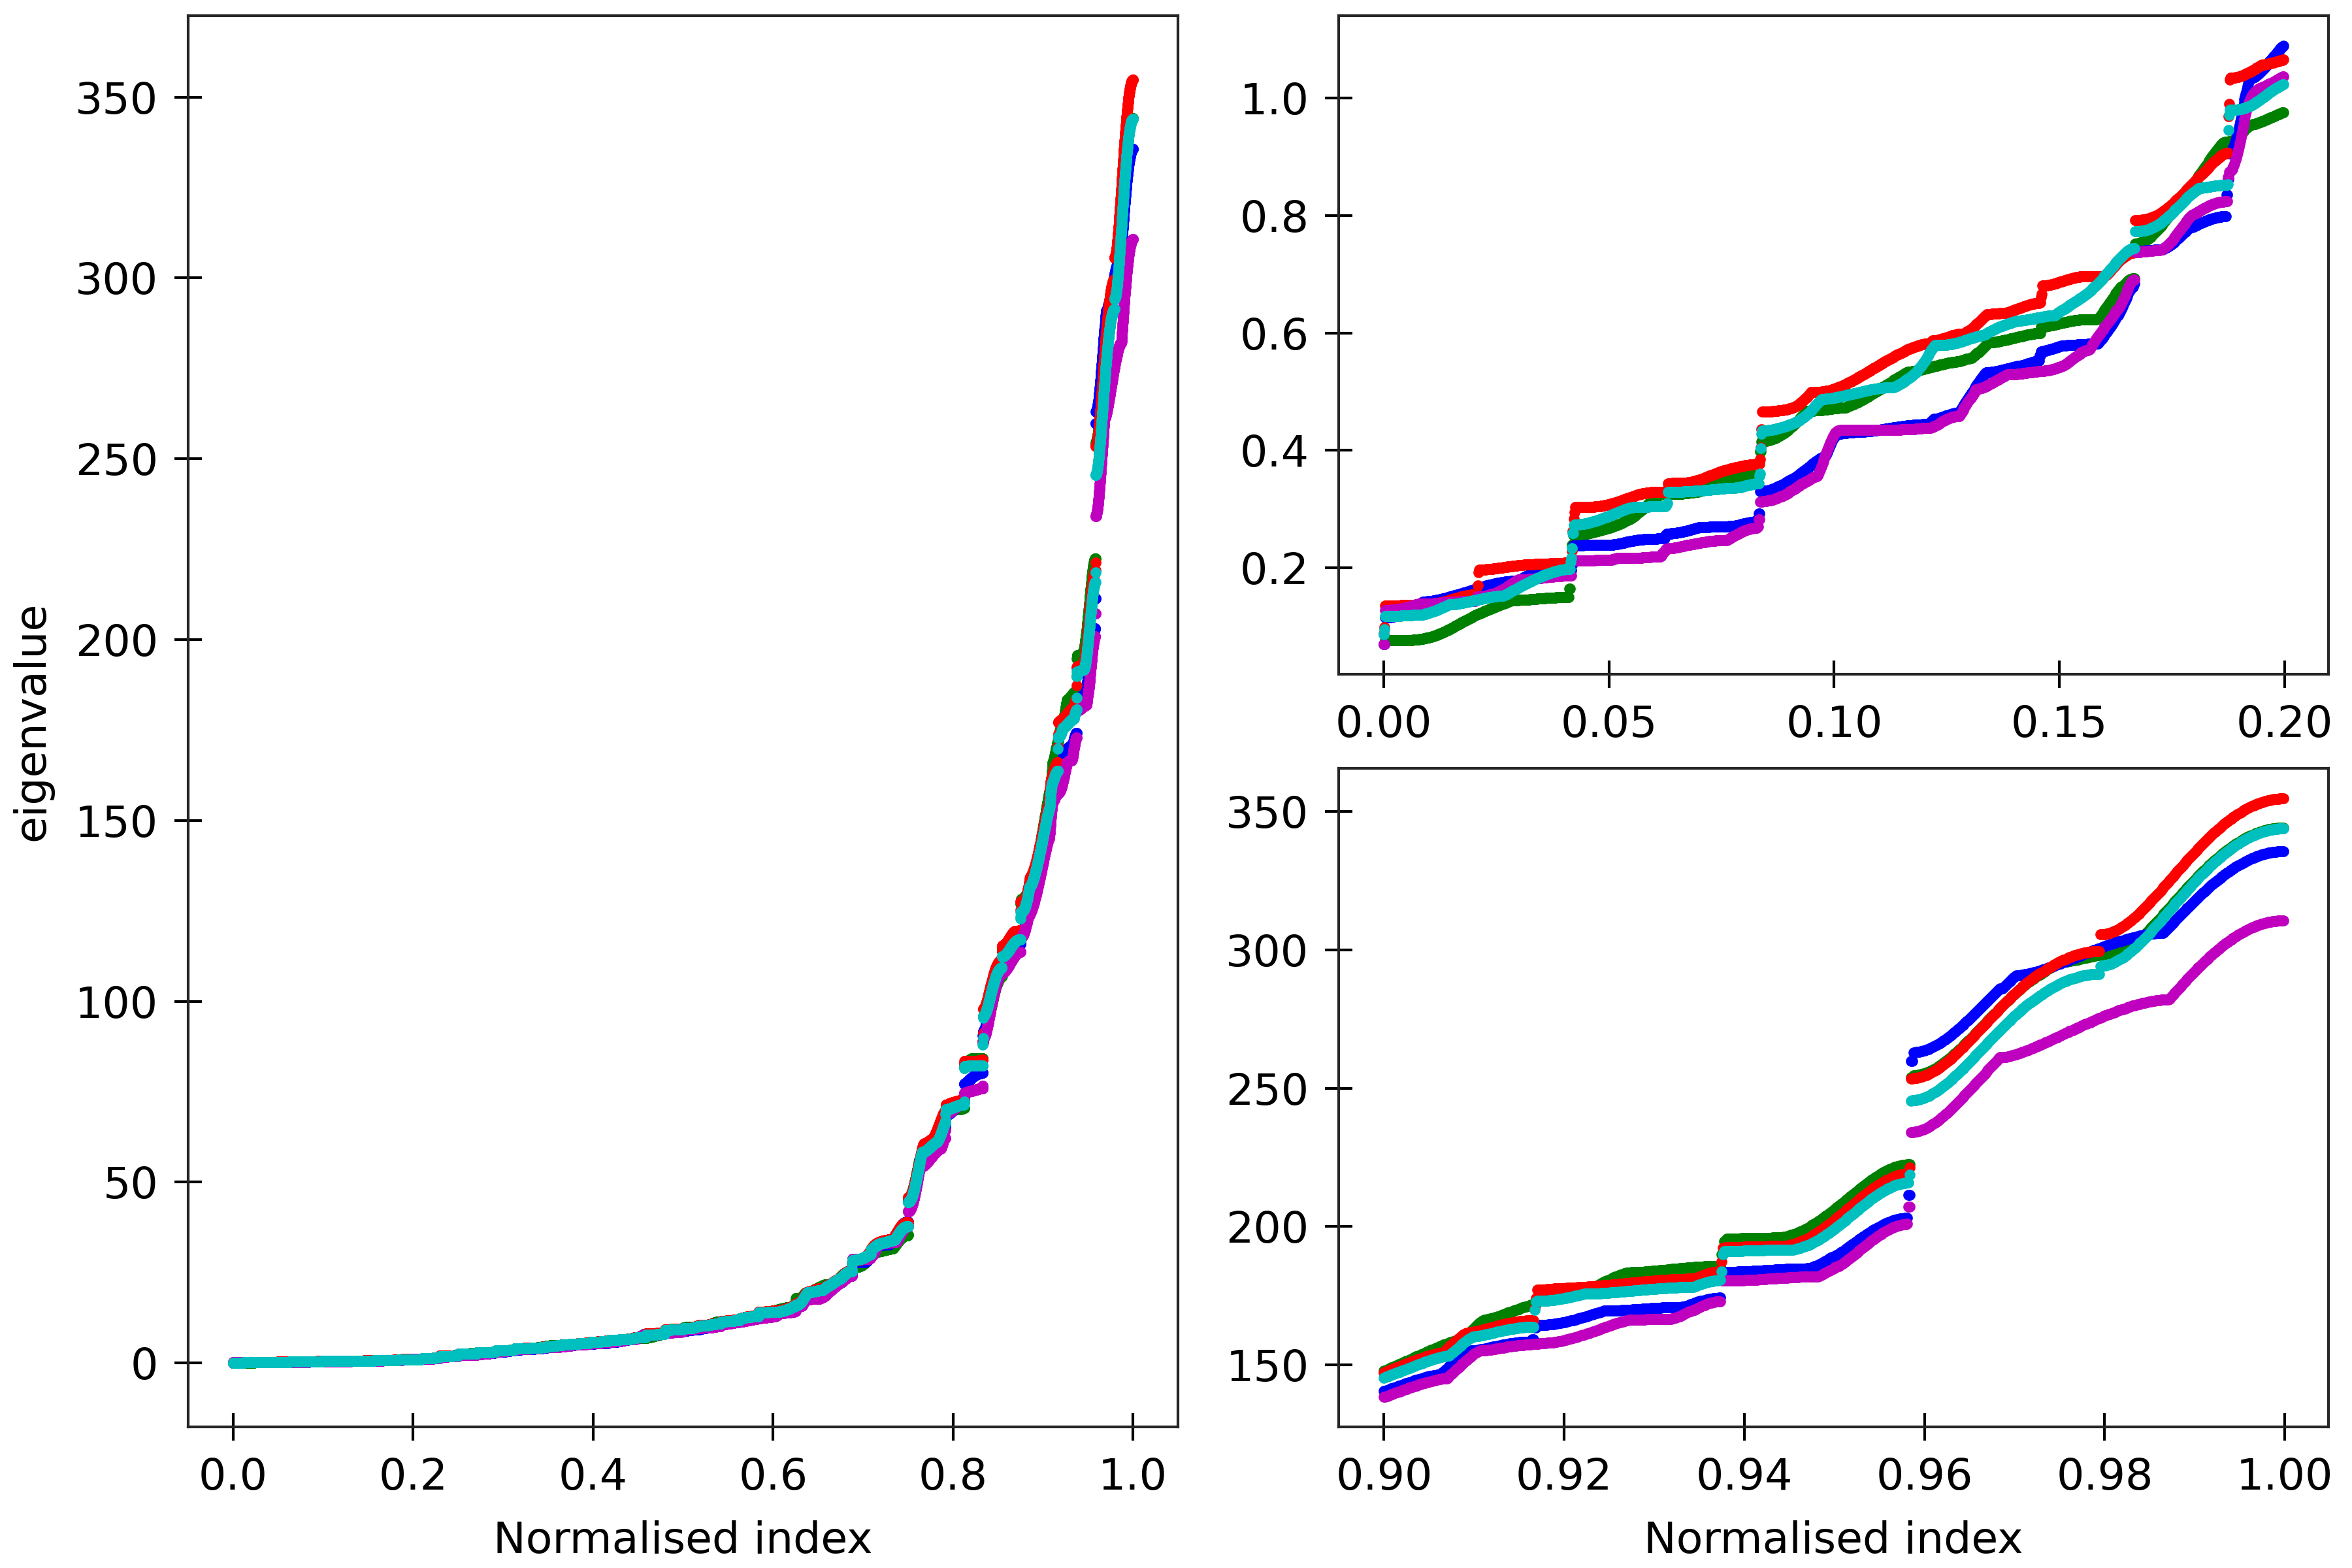
Figure 9
The cgNA+ stiffness matrix for a sequence of length n has 24n-18 eigenvalues, all
real and positive, which can be sorted in ascending order and plotted against their index
(scaled to always lie in [0,1] to facilitate comparison of spectra for sequences of different
lengths). Spectra are here compared for (CG)_150 (green), (MN)_150 (blue), (MG)_150 (red),
(HK)_150 (magenta), and (HG)_150 (cyan). All the sequences are taken in GC ends.
The two insets on the right are magnifications
of the lower and upper parts of the spectra.
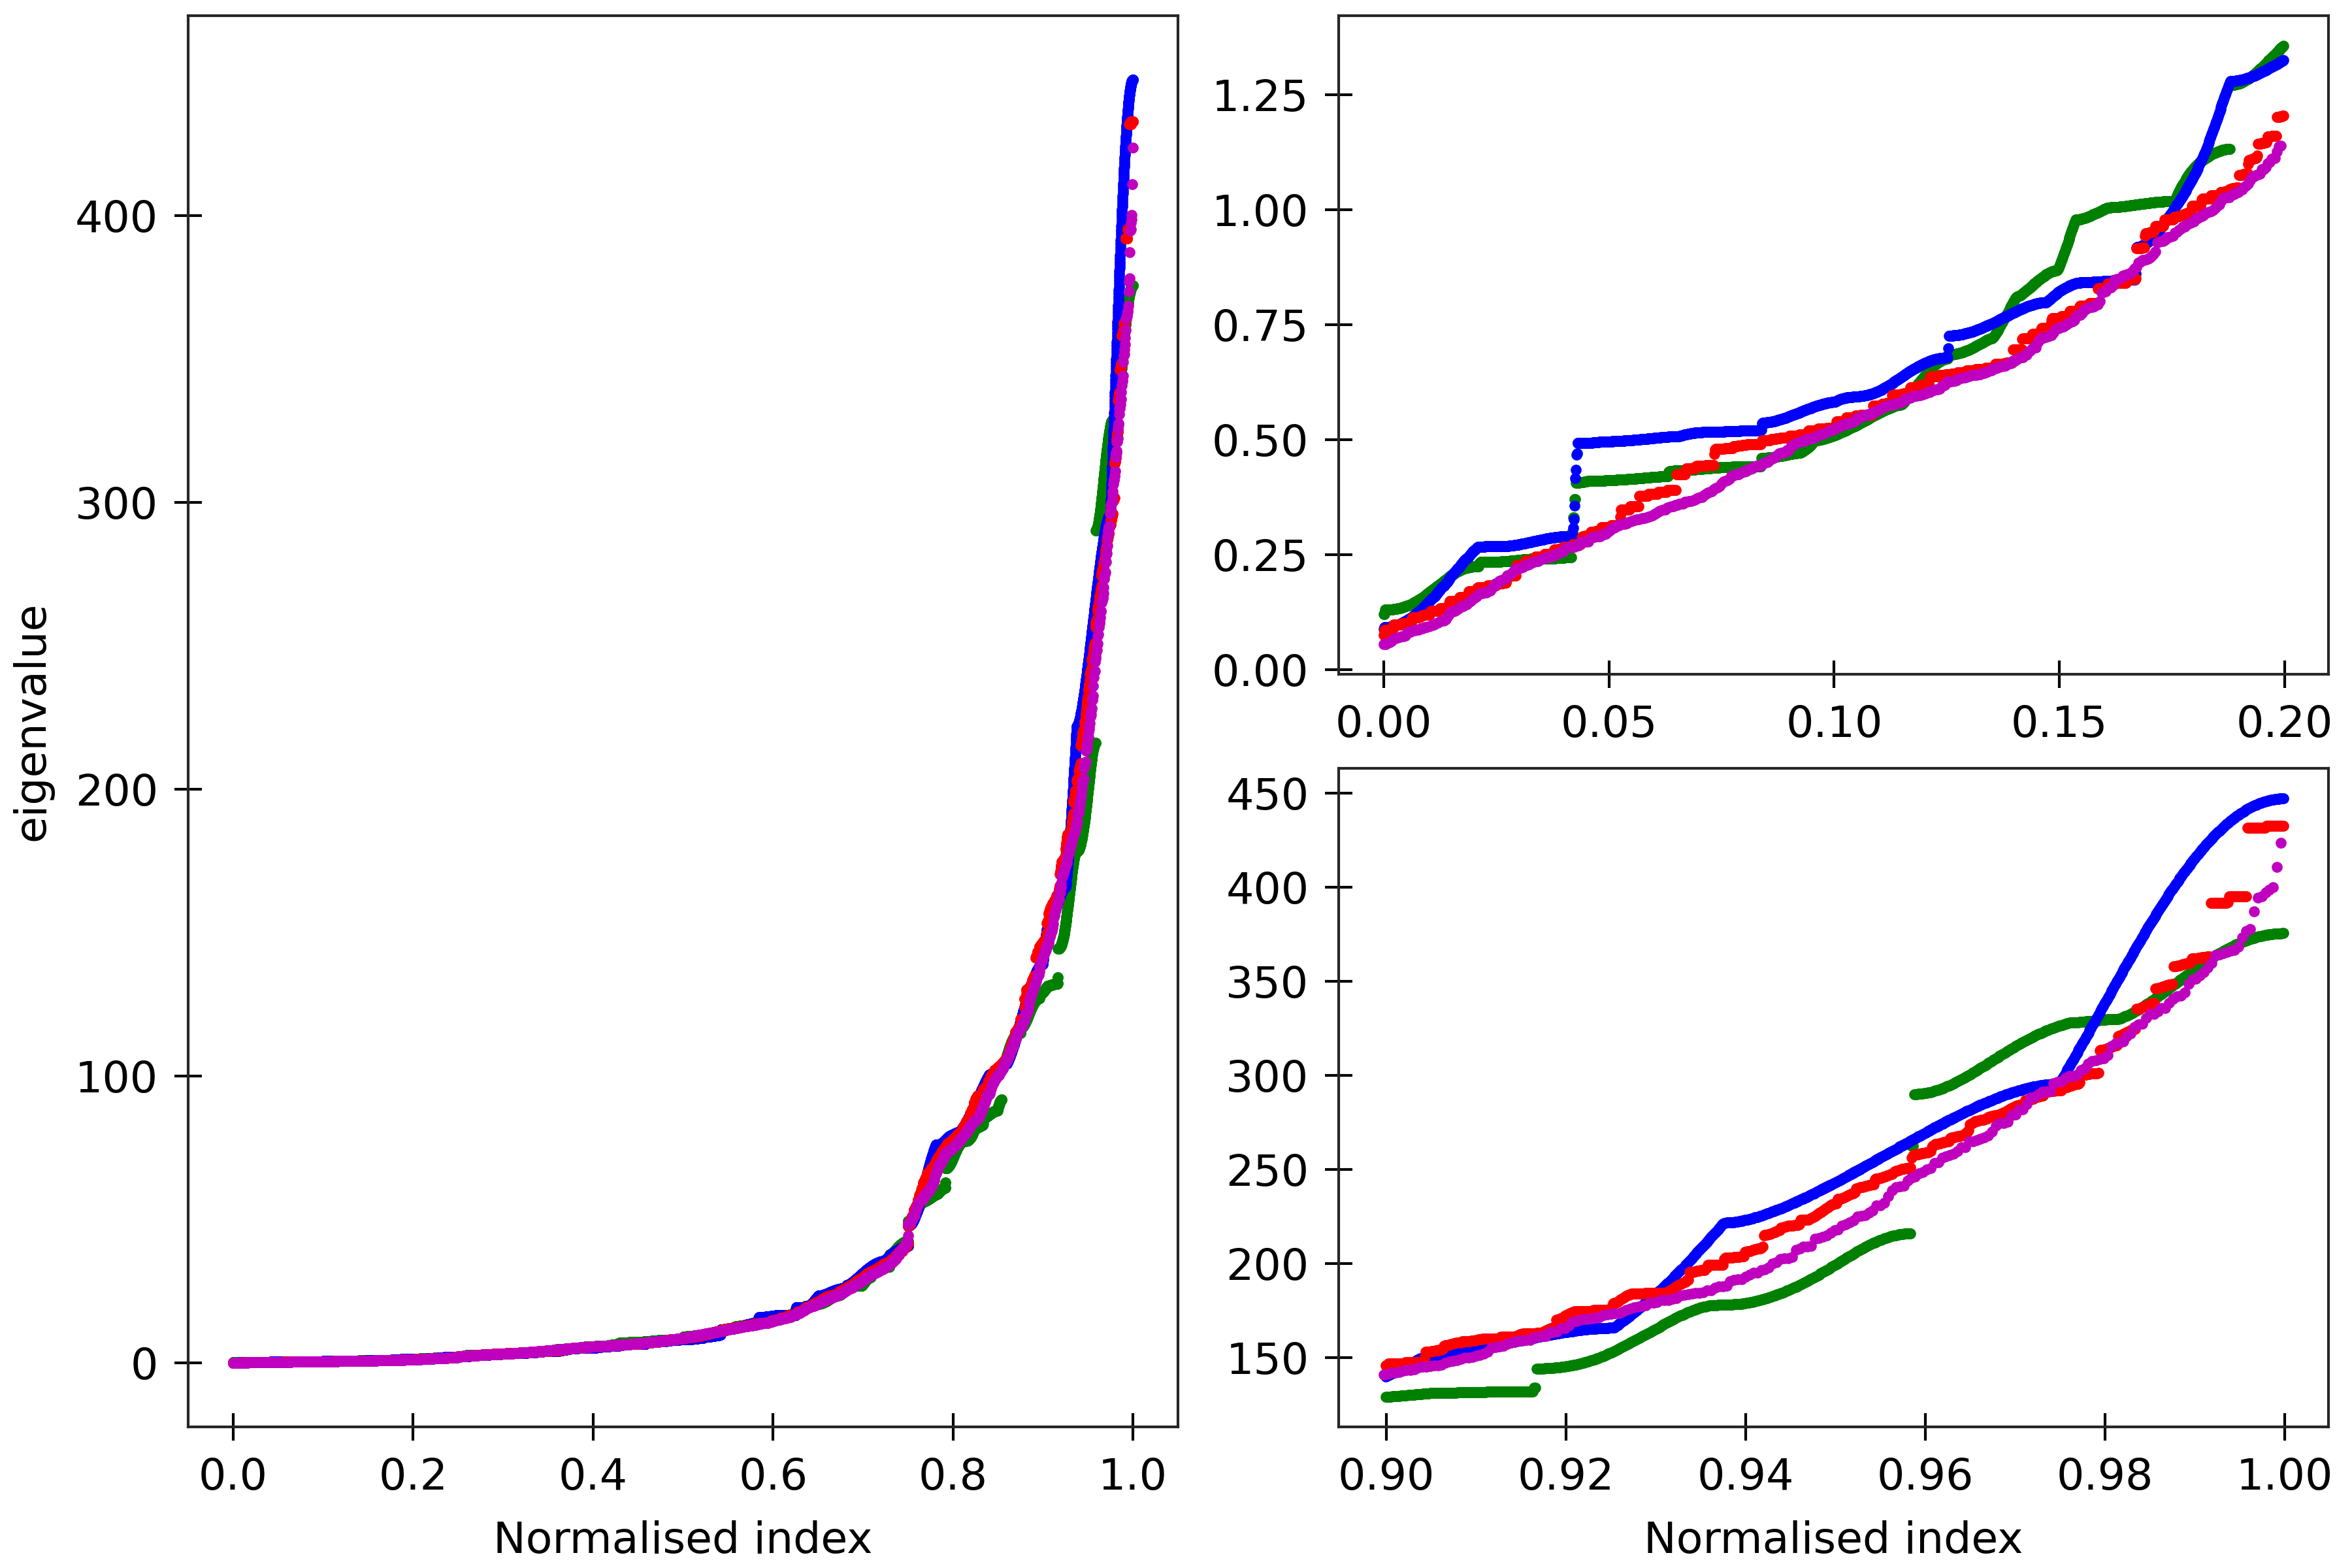
Figure 10
The cgNA+ stiffness matrix for a sequence of length n has 24n-18 eigenvalues, all
real and positive, which can be sorted in ascending order and plotted against their index
(scaled to always lie in [0,1] to facilitate comparison of spectra for sequences of different
lengths). Spectra (computed using ‘DNA PS2’ parameter set) are here compared for four
dsDNA sequences A_300 (blue), (AT)_150 (green), the Widom 601 positioning sequence
(magenta) and the A-tract sequence (A_5G_5T_5C_5T)_15 (red). All the sequences are taken in GC ends.
The two insets on the right
are magnifications of the lower and upper parts of the spectra.
Persistence length spectra
Another interesting observable to look at is persistence length which is a
popular and traditional quantification of the NA rigidity defined as the
length scale over which correlations in the direction of tangent along a polymer centerline are lost.
More appropriate definition in the context of sequence-dependence was introduced in Mitchel et. al
by factoring out the intrinsic shape contribution from the apparent persistent length (ℓp) to define
sequence-dependent dynamic persistence length (ℓd) which solely quantifies the intrinsic rigidity of the NA.
Even though it is possible to run MC simulation in the Python and
Matlab/Octave version,
for heavier computations we recommend C++ code
In this section, we have presented the observed persistence length spectra for millions of dsNA fragments computed
using cgNA+mc C++ code.
In Figure 7, the top panel plot the spectra for sequence-dependent apparent persistent length (ℓp) and dynamic persistence length (ℓd)
while the bottom panel presents histograms for sequence-wise difference in persistence lengths of dsRNA and DRH from dsDNA.
The computations were performed for 2 million random sequences of length 220 base-pairs and each computation involved 0.1 million MD samples.
Note that the persistence length predicted by the cgNA+ model is, in general,
considerably higher than the experimental consensus of 150 bps for dsDNA fragments.
But more importantly, as rigorously demonstrated in Mitchel et. al
the trends in sequence-dependent persistence lengths of dsDNA are
similar to those observed in the experiments.
Notably, for shorter sequences (24mer) (refer to A. Patelli's thesis for details),
the tangent-tangent correlation observed
in the MD simulations is incredibly close to cgNA+ predictions implying that
this discrepancy is not inherent to the model.
There can be several reasons for this discrepancy
of persistence lengths given by cgNA+ tools. Firstly, in experiments, the salt concentration is
relatively higher, and often divalent counter ions are used as opposed to mono-valent ions under
physiological concentrations in the MD simulations (used to train the cgNA+ model), which
have a significant effect on the persistence length of dsDNA (or dsNA).
Moreover, the parameterization of DNA in various MD forcefields might be stiffer.
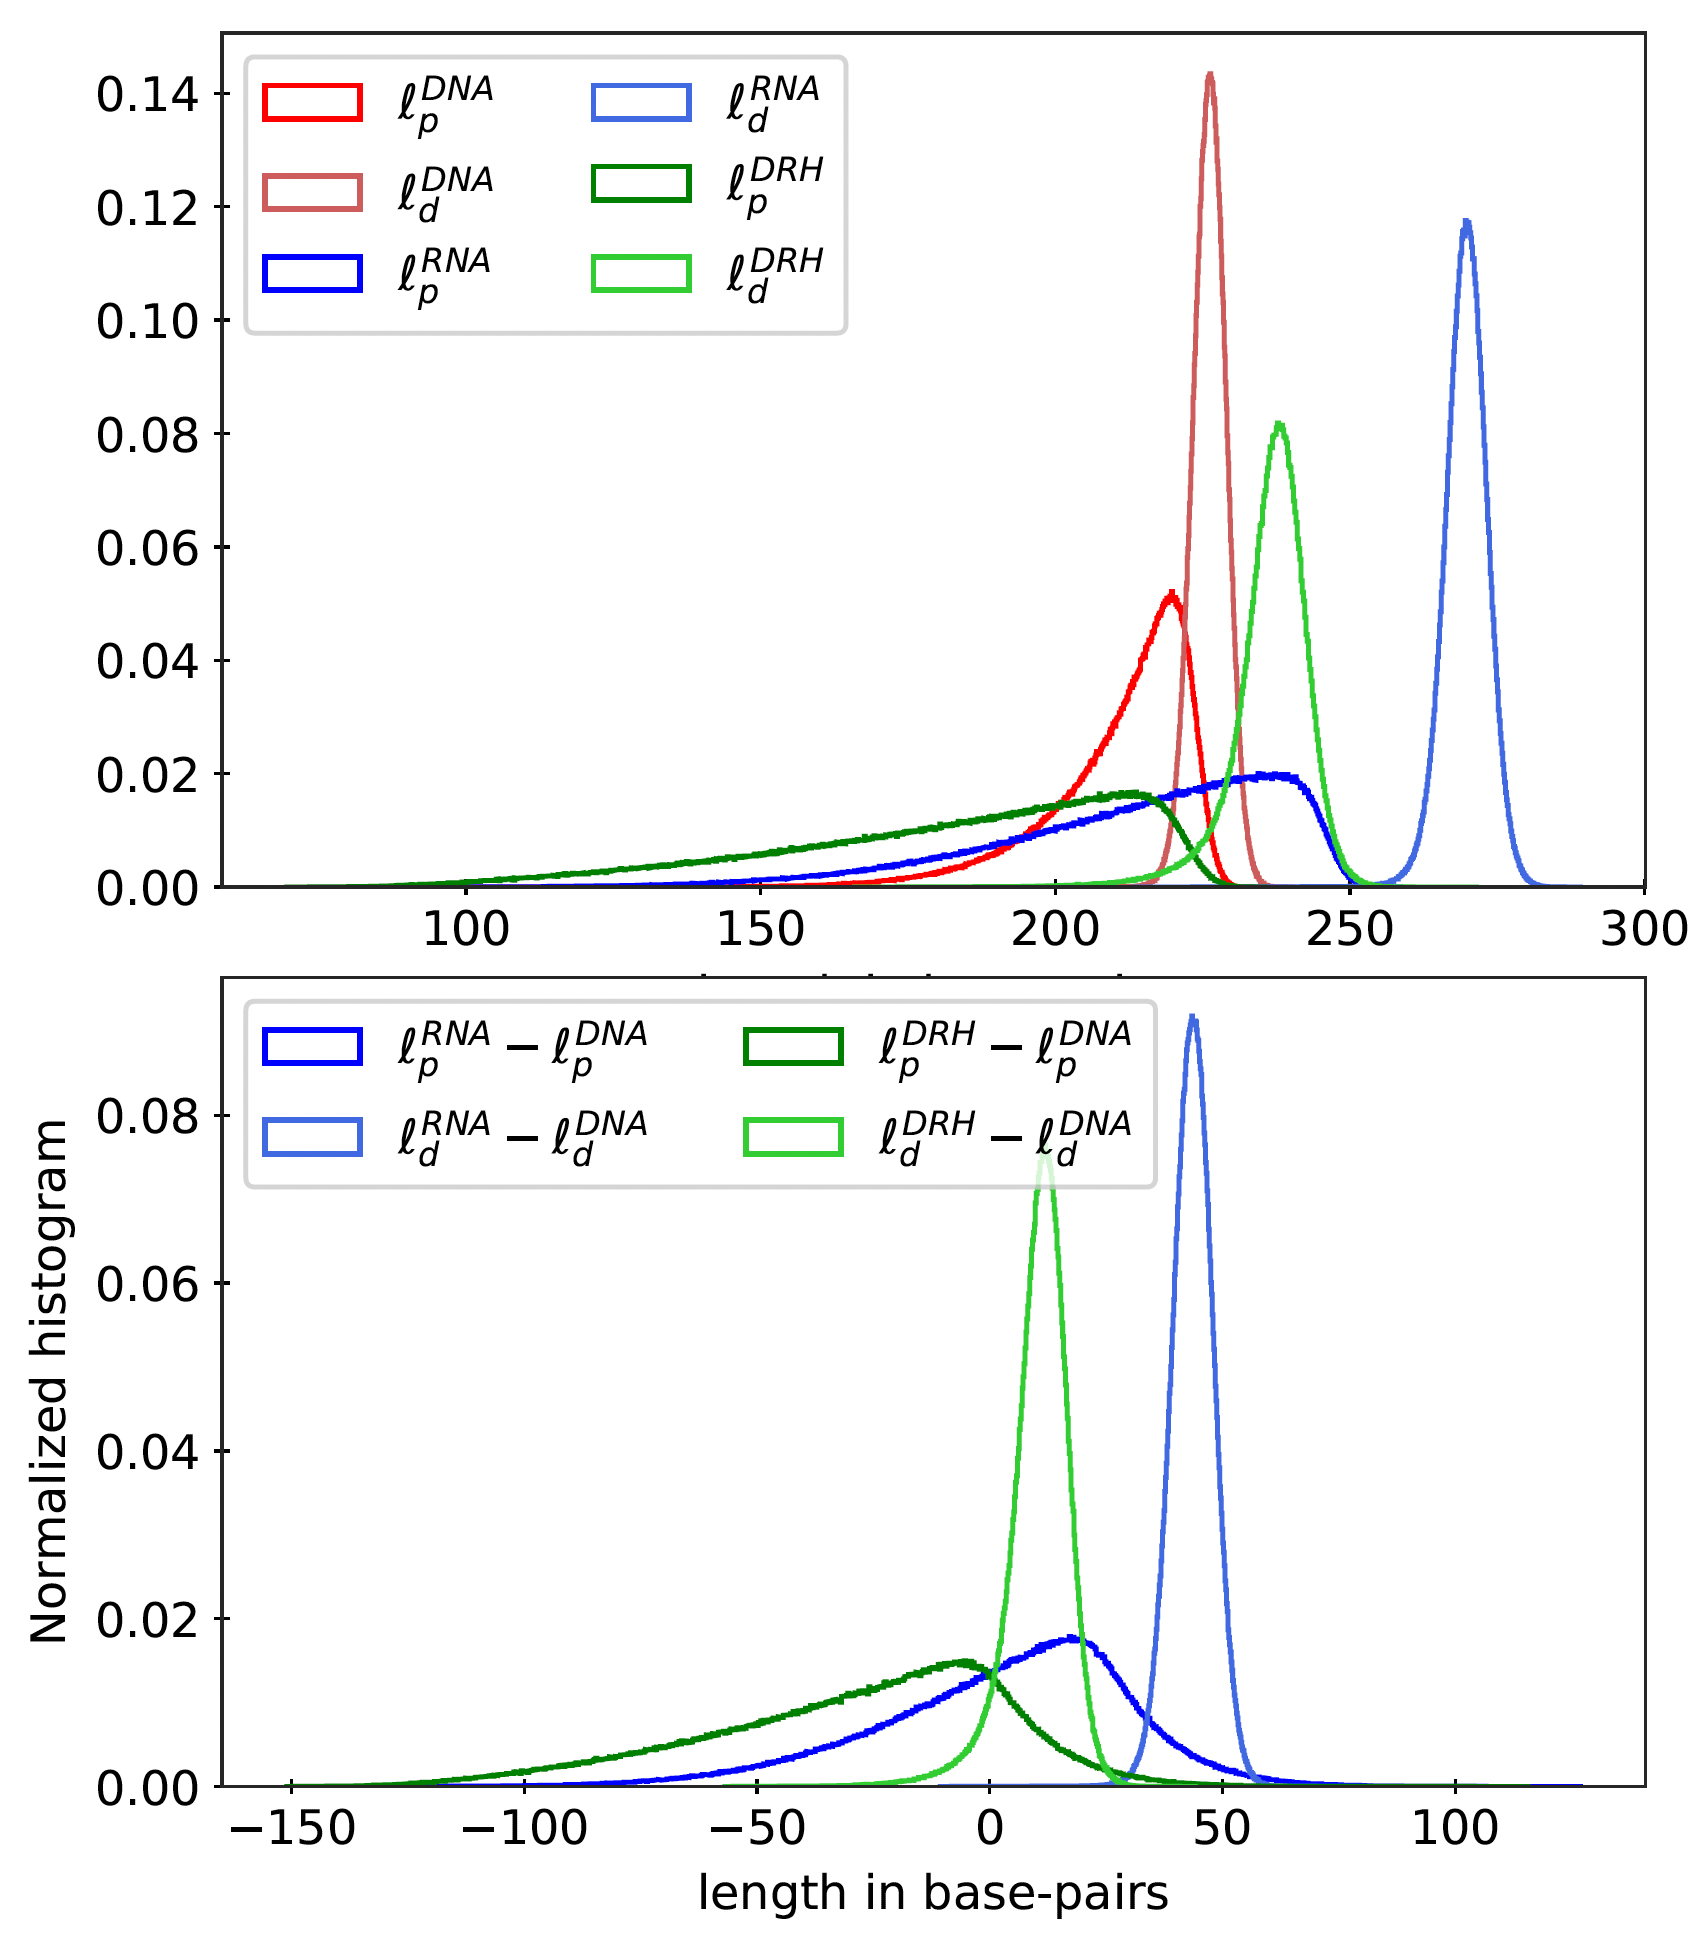
Figure 11
Top: Histogram for dynamic (ℓd) and apparent (ℓp) persistence lengths for ≈ 2 million
random sequences (of length 220 bp) and all poly-dimers (110 repeats) for dsDNA, dsRNA, and
DRH. Bottom: Histogram for sequence-wise difference in persistence lengths of dsRNA and
DRH from dsDNA.
In Figure 8, we have plotted the persistence length of all poly-dimers for various dsNA fragments.
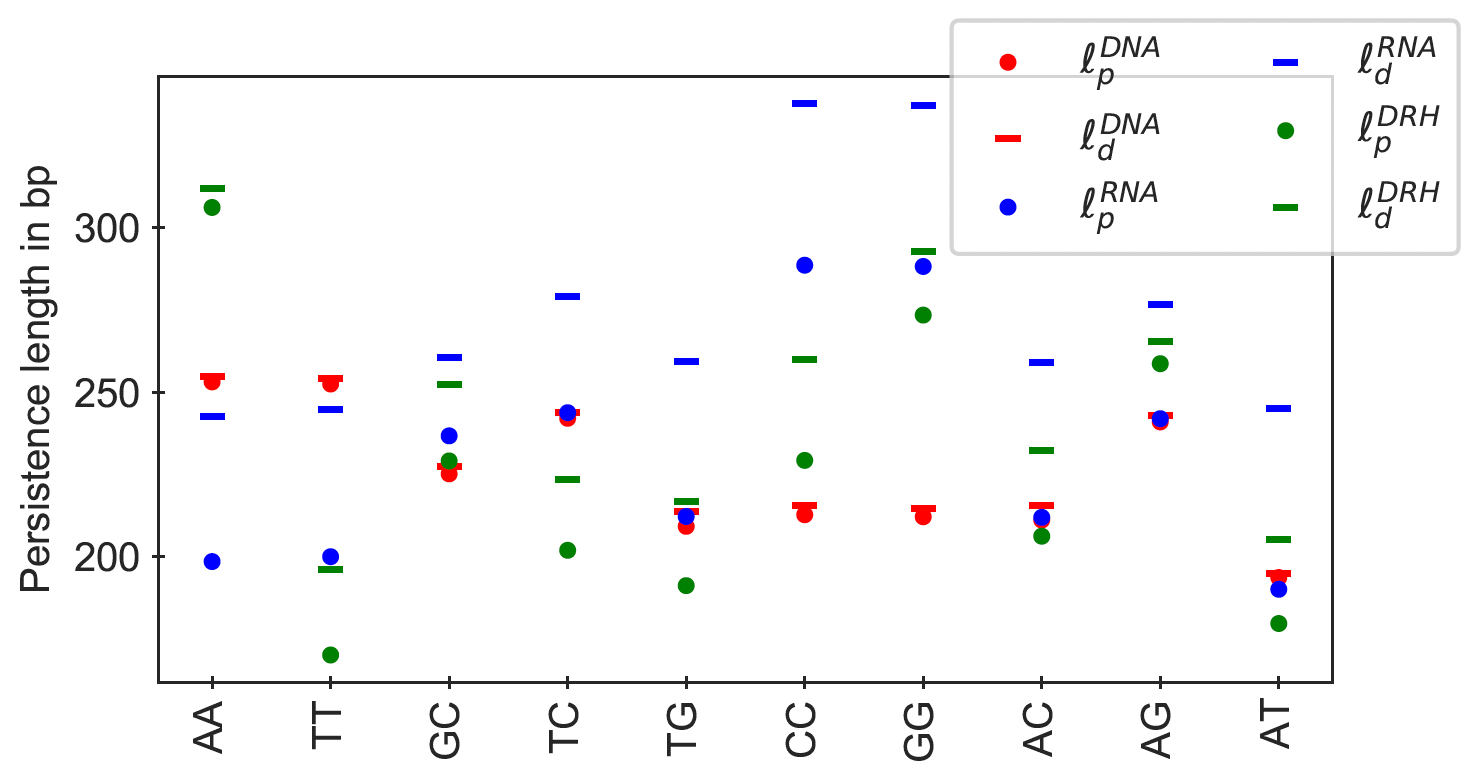
Figure 12
Dynamic (ℓd) and apparent (ℓp) persistence lengths for all independent poly-dimers
((XY)110 embedded in GC ends) for dsDNA, dsRNA, and DRH.
Relevant citations
[1] cgNA+web: A web based visual interface to the cgNA+ sequence dependent statistical mechanics model of double-stranded nucleic acids.
R. Sharma, A. S. Patelli, L. De Bruin, and J.H. Maddocks
Journal of Molecular Biology, 167978 (2023)
DOI:10.1016/j.jmb.2023.167978
[2] cgNA+: A sequence-dependent coarse-grain model of double-stranded nucleic acids.
R. Sharma, EPFL Thesis #9792 (2022)
Download the PDF here.
[3] A sequence-dependent coarse-grain model of B-DNA with explicit description of bases and phosphate groups parametrised from large
scale Molecular Dynamics simulations
A.S. Patelli
EPFL PhD Thesis #9552 (2019)
PDF available here
[4] cgDNAweb: a web interface to the cgDNA sequence-dependent coarse-grain model of double-stranded DNA.
L. De Bruin, J.H. Maddocks
Nucleic Acids Research 46, issue W1 (2018), p. W5-W10
DOI:10.1093/nar/gky351
[5] Absolute versus relative entropy parameter estimation in a coarse-grain model of DNA
O. Gonzalez, M. Pasi, D. Petkevičiūtė, J. Glowacki, J.H. Maddocks
Multiscale Modeling and Simulation 15, no. 3 (2017), p. 1073 - 1107
DOI:10.1137/16M1086091
[6] Sequence-Dependent Persistence Lengths of DNA
J.S. Mitchell, J. Glowacki, A.E. Grandchamp, R.S. Manning, J.H. Maddocks
Journal of Chemical Theory and Computation 13 (2017), p. 1539-1555
DOI:10.1021/acs.jctc.6b00904
[7] cgDNA: a software package for the prediction of sequence-dependent coarse-grain free energies of B-form DNA
D. Petkevičiūtė, M. Pasi, O. Gonzalez, J.H. Maddocks
Nucleic Acids Research 42, no. 20 (2014), p. e153
DOI:10.1093/nar/gku825
[8] μABC: a systematic microsecond molecular dynamics study of tetranucleotide sequence effects in B-DNA
M. Pasi, J.H. Maddocks, D. Beveridge, T.C. Bishop, D.A. Case, T. Cheatham III, P.D. Dans, B. Jayaram, F. Lankas, C. Laughton, J. Mitchell, R. Osman, M. Orozco, A. Pérez, D. Petkevičiūtė, N. Spackova, J. Sponer, K. Zakrzewska, R. Lavery
Nucleic Acids Research 42, no. 19 (2014), p. 12272–12283
DOI:10.1093/nar/gku855
[9] A sequence-dependent rigid-base model of DNA
O. Gonzalez, D. Petkevičiūtė, J.H. Maddocks
Journal of Chemical Physics 138, no. 5 (2013), p. 055122 1-28
DOI:10.1063/1.4789411
